Lesson 9 · 10 min
Profile Patterns and Day Types
You’ll learn
- The four common day types: normal, normal variation, trend and double distribution
- How each type is described by its profile and its opening range
- Why a day type is a label applied afterwards, and what its limits are
3.1 Why day types exist
Not every day looks the same. Market Profile traders group days into types based on how the profile develops. The groups help you describe a session, compare it with past ones and notice when something unusual is happening. Guide 1 introduced profile shapes (bell, P, b, thin, double). Here we look at how those shapes relate to the structure of the day.
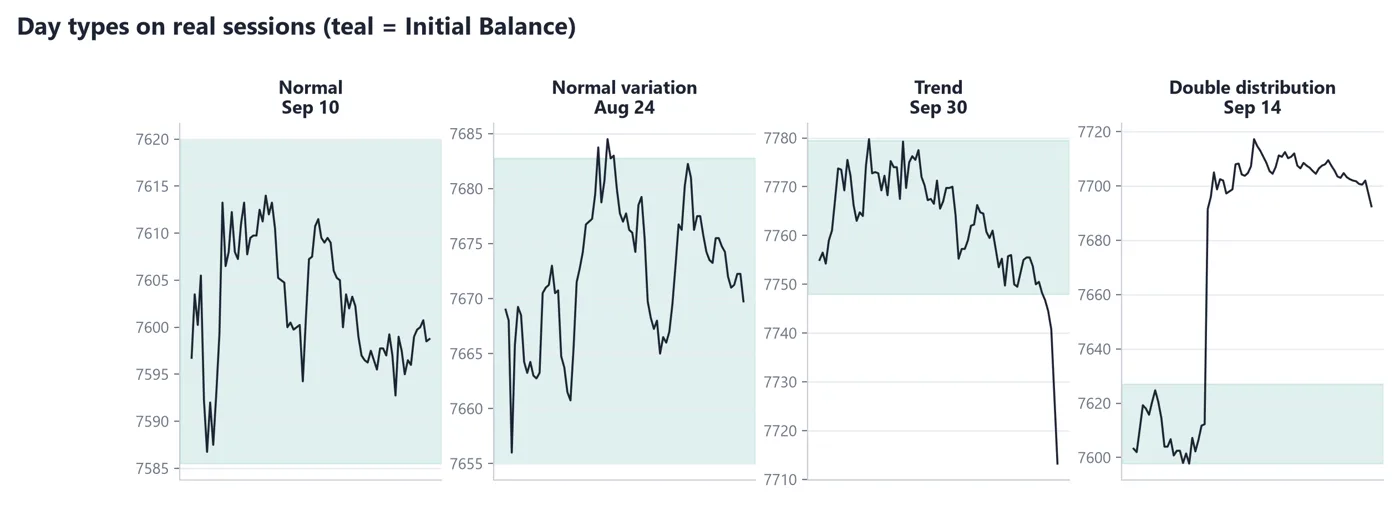
- 1Normal: most of the day stays inside the first hour's range.
- 2Normal variation: the day pushes outside the first hour's range on one side.
- 3Trend: price moves in one direction for most of the session.
- 4Double distribution: two areas of trade with a quick move between them.
3.2 The four types
| Day type | Typical description | What it often looks like |
|---|---|---|
| Normal | Wide first-hour range; most trade stays inside it | Bell profile; value area near the middle |
| Normal variation | First-hour range is pushed outside on one side | Bell with an extension; value area shifts a little |
| Trend | One-directional move for most of the session | Thin, elongated profile; POC near one end |
| Double distribution | Two separate areas of trade | Two fat nodes with a thin gap |
Why bother naming them? Because naming forces you to look at structure, not just direction. Two days can both close higher, yet one was a quiet rotation inside the first hour and the other was a long one-way push. They call for different questions the next morning, such as whether the market is still in balance or has moved to new value.
A second reason is comparison. When you label forty sessions, you can see what share were normal, what share extended and how the next day tended to open after each type. That is far more useful than a single memorable chart, because it is your own sample, with the boring days included.
A normal day is one in which the early range, set in the first hour, does the heavy lifting. The rest of the session mostly rotates within it. A normal variation day starts similarly but then breaks out of the early range on one side, building a somewhat shifted value area.
A trend day is a strong, mostly one-way session. October 30, 2026 was a trend day down with an intraday range of about 196 points. Profiles of trend days are thin because price does not stay anywhere long enough to pile up letters. A double distribution day shows a first area of trade, a fast move through a thin zone, and a second area of trade. It is a different pattern from a trend day: the second area is where the market settles again.
3.3 Labels come after the fact
You can only be sure what type of day it was when it is over. At 11 AM, a normal day and a normal variation day look the same. The label is useful for review and for studying how often each type follows a certain opening, but it should not be treated as a forecast during the session.
A more practical habit is to keep a short list of possibilities as the day develops. 'So far the day is inside the first hour's range. If it breaks out and builds value, it may become a variation or a double distribution.' That keeps your mind open without pretending to know.
If you want to see the shapes without the structure, compare these pictures with the five profile shapes in Guide 1, Lesson 3. The shapes are the same family. This lesson adds the question of how the day got there.
- Four common day types: normal, normal variation, trend, double distribution.
- A trend day is thin and elongated (Oct 30, 2026 was about 196 points in one direction).
- A double distribution is not the same as a trend day: it has two areas of agreement.
- Labels come after the fact; during the day, keep a list of possibilities.
Quick check
Pass with 2 of 3 to complete the lesson (+20 XP, plus 5 XP per correct answer the first time).
1.A normal variation day is one where...
2.A double distribution differs from a trend day because...
3.Day-type labels are best used...