Lesson 2 · 9 min
Payoffs at expiry and breakeven
You’ll learn
- How to draw the profit and loss of a long call and a long put at expiry
- How to calculate breakeven and maximum loss
- Why 'right direction' is not the same as 'profit'
2.1 The long call at expiry
A payoff diagram shows profit or loss on the vertical axis and the underlying price at expiry on the horizontal axis. It ignores time before expiry, which makes it the simplest picture of an option. We start with a long call: a call you bought.
Hypothetical example. SPY is 600. You buy one 600-strike call for 4.50, paying 4.50 x 100 = $450. At expiry the call is worth the larger of zero and (SPY price minus 600). Your profit per share is that value minus the 4.50 you paid.
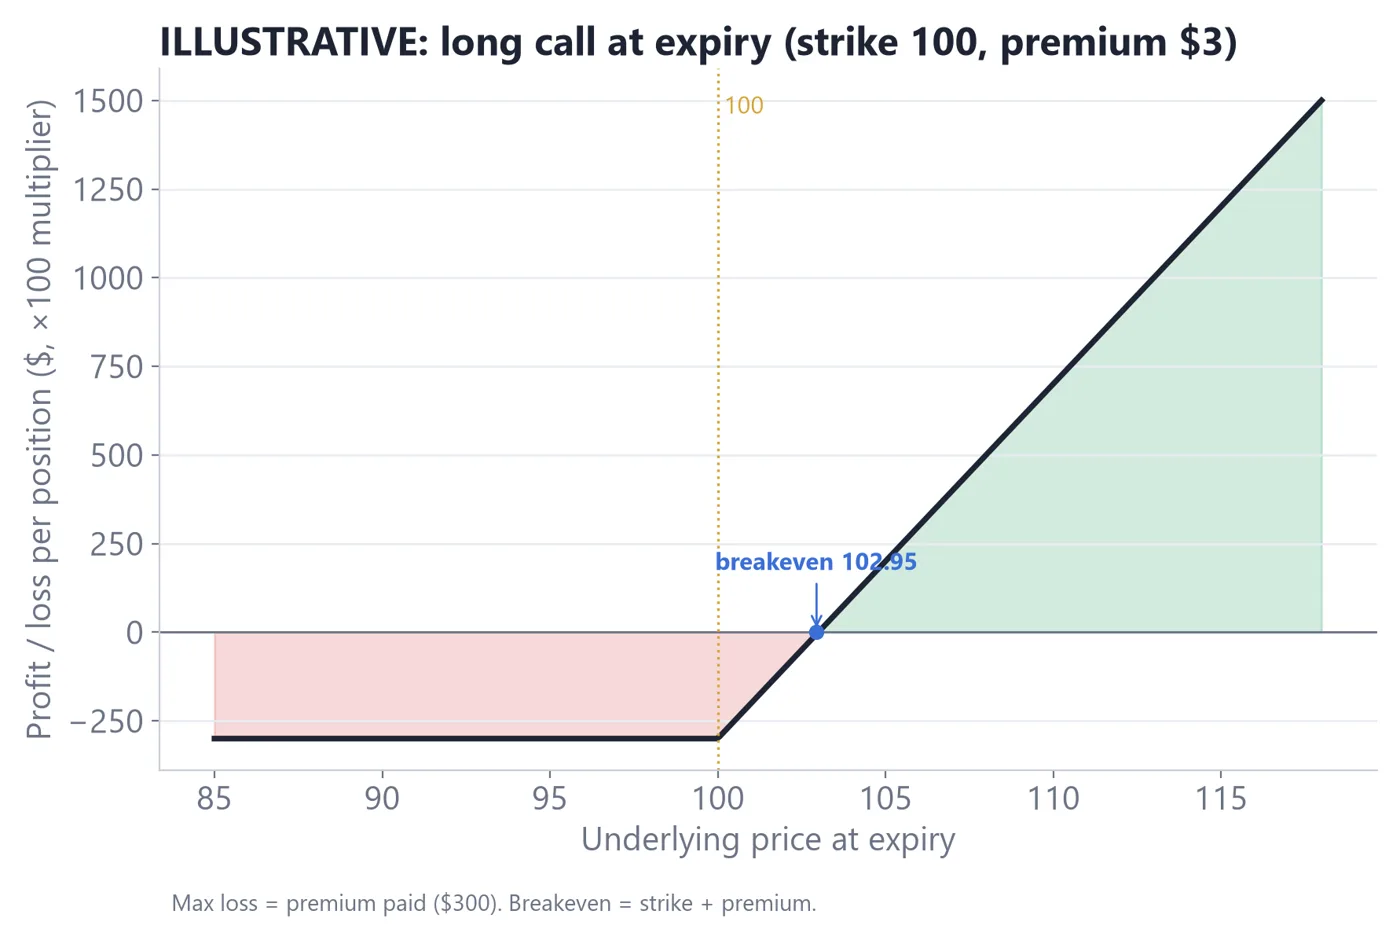
- 1Below the strike the option expires worthless: the loss is flat at the premium paid.
- 2The breakeven is the strike plus the premium: 600 + 4.50 = 604.50.
- 3Above the breakeven, profit rises 1 point per share for each 1-point rise in SPY.
- 4The maximum loss is known in advance: $450 here.
| SPY at expiry | Call value | Profit per share | Profit per contract |
|---|---|---|---|
| 590 | 0 | -4.50 | -$450 |
| 600 | 0 | -4.50 | -$450 |
| 604.50 | 4.50 | 0 | $0 (breakeven) |
| 610 | 10.00 | +5.50 | +$550 |
Look at the 600 row. SPY finished exactly where it started, which is not a loss on a stock position, yet the call buyer lost the full $450. Direction alone is not enough. The move must be large enough to cover the premium and must happen before expiry.
2.2 The long put at expiry
A long put gains when the underlying falls below the strike. Hypothetical example. SPY is 600. You buy one 600-strike put for 5.00, paying 5.00 x 100 = $500. At expiry the put is worth the larger of zero and (600 minus SPY price).
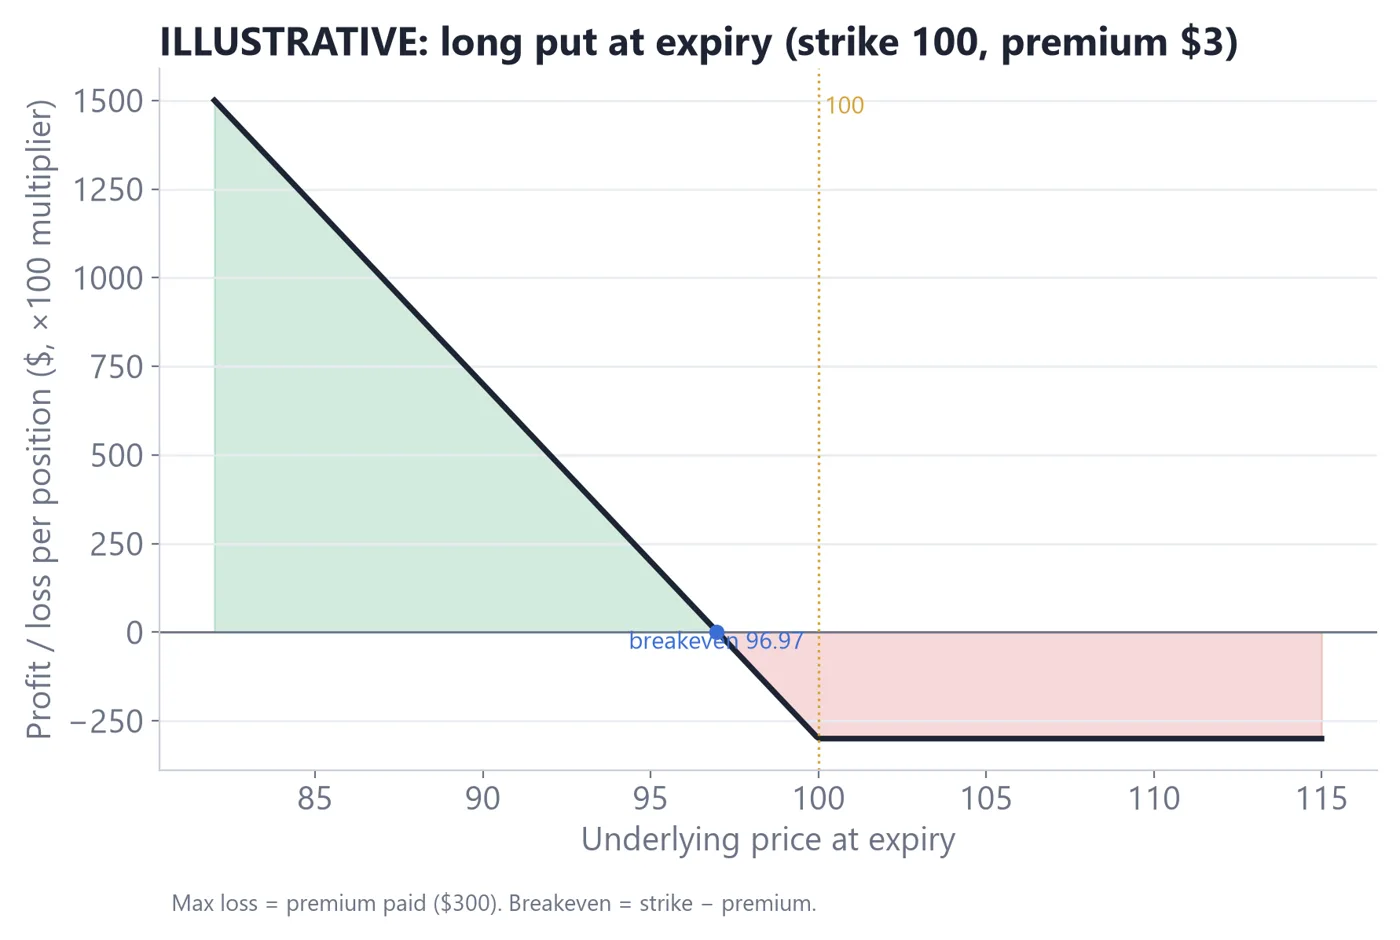
- 1Above the strike the put expires worthless: the loss is flat at the premium paid, $500.
- 2The breakeven is the strike minus the premium: 600 - 5.00 = 595.
- 3Below 595, profit grows 1 point per share for each 1-point drop in SPY.
- 4The most a put can be worth is the strike (if SPY went to zero), which is a theoretical limit only.
Check one point. If SPY falls to 585 at expiry, the put is worth 600 - 585 = 15.00. Profit per share is 15.00 - 5.00 = 10.00, so profit per contract is 10.00 x 100 = $1,000. If SPY ends at 598, the put is worth 2.00, the profit per share is 2.00 - 5.00 = -3.00, and the loss is $300: SPY fell, yet the buyer lost money.
2.3 Payoff versus reality before expiry
The diagrams describe the very end. Most traders do not hold to expiry. Before expiry the option still has time value, so its price follows a smooth curve above the hockey-stick shape. That curve is why Lessons 3 to 5 exist. For now, use the payoff diagram for two simple jobs: finding the breakeven and the maximum loss before you buy.
A skipped trade is often the right result of this exercise. Hypothetical example that is skipped. A trader hopes SPY will rise 1% in a week. SPY is 600, so 1% is 6 points. The 600 call costs 4.50, so the breakeven is 604.50, a 0.75% rise. The trader checks the next expiry before the hoped-for date and sees the option expires in four days. A move of 1% might arrive after expiry. The trader concludes the setup does not fit the time available and skips it. Noting why you skipped is as useful as logging a trade.
One more habit helps. Before buying, write the three numbers side by side: the cost in dollars (premium x 100), the breakeven price and the date the right expires. If you can state all three from memory in ten seconds, you understand the position well enough to size it. If you cannot, wait.
- A long call or long put loses at most the premium paid, and it loses all of it if the option expires worthless.
- Call breakeven is strike plus premium; put breakeven is strike minus premium.
- The underlying can move your way and the position can still lose money.
- Payoff diagrams show expiry outcomes only; they are not forecasts.
Quick check
Pass with 2 of 3 to complete the lesson (+20 XP, plus 5 XP per correct answer the first time).
1.You buy a 600 call for 4.50. What is the breakeven at expiry?
2.You buy a 600 put for 5.00. SPY ends at 598 at expiry. What is the result per contract?
3.What is the maximum loss for the buyer of one call?