FREE SUPPLEMENT 1 OF 5 · TO LEARN TO TRADE IN 31 DAYS
Volume, Volume Profile & Market Profile
See where the market did business, and read the auction behind every move
12 lessons~121 minBeginner to intermediate
Educational only. Not financial advice. Futures trading involves substantial risk of loss and is not suitable for every investor. Past market behaviour shown here does not predict future results.
WHITE FEATHER FINANCE
Important: please read
Educational only. Not financial advice. This book teaches how traders read market data and manage risk. It does not tell you what to buy or sell.
Trading involves substantial risk of loss. Futures are leveraged and can lose more than your deposit. Options can expire worthless, and selling options can lose far more than the premium received. Only trade money you can afford to lose.
Past market behaviour does not predict future results. Charts and examples are historical or hypothetical, for illustration only. Rules of thumb quoted from trading literature are heuristics, not guarantees.
White Feather Finance is an education company, not a registered investment adviser, broker-dealer or commodity trading advisor.
How to use this book
This supplement joins two topics that belong together: Volume Profile (where volume traded, by price) and Market Profile (how the auction unfolded through time). Lessons 1-6 build the profile on real ES futures charts; lessons 7-12 add TPO letters, auction theory, day types and the initial balance. Every idea has a real chart, a 5-minute task and a quick check.
Before you start: Days 1-9 of Learn to Trade in 31 Days, or basic candlestick and volume reading.
📖 ReadPlain-English explanations; every term is in the glossary.
📊 SeeEvery concept has a chart or a labelled diagram.
🛠️ DoA 5-minute "Try it" task and a 3-question quick check for each lesson.
🎬 WatchShort companion videos on YouTube @WFeatherFinance.
The difference between volume over time and volume at price
How charting software builds a profile, row by row
The five levels every profile has: POC, VAH, VAL, HVN, LVN
1.1 When vs where
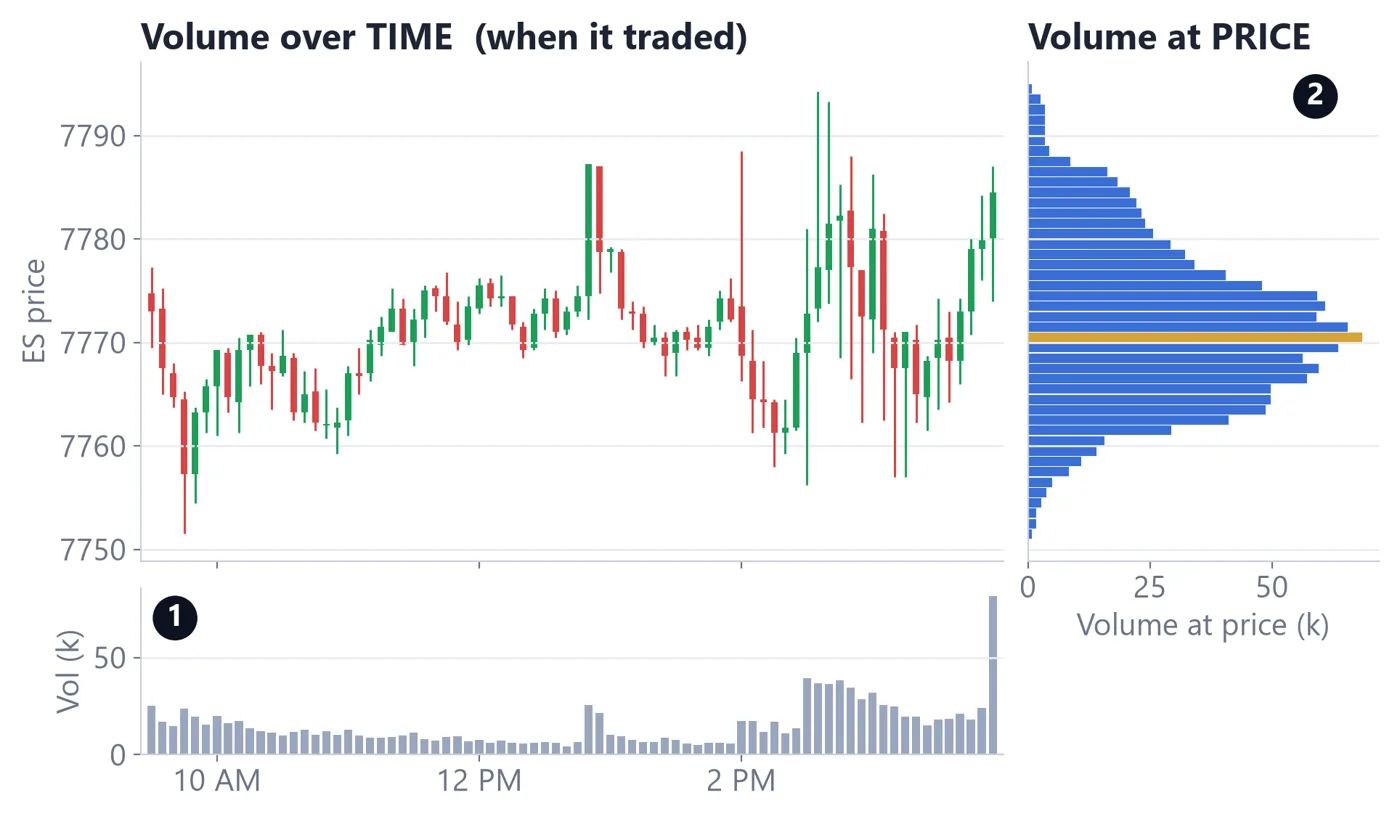
The volume bars under a normal chart answer one question: when did trading happen? Volume Profile answers a different one: where, at which prices, did trading happen? It adds up every contract traded at each price and draws the total as a horizontal bar beside the price axis.
Figure 1.1. The same day, counted two ways (ES, Oct 28, 2026)
How to read it
1Volume over time: busy at the open and into the close, quiet at lunch.
2Volume at price: most contracts changed hands near 7,770.75 (gold), even though price visited 7,751–7,794.
Real ES futures data (Yahoo Finance ES=F, 5-minute bars, regular session 9:30 AM–4:00 PM ET). Volume at price is approximated by spreading each 5-minute bar's volume across the prices it traded through.
1.2 How the profile is built
Your charting software does this for you, but knowing the steps helps you read the result:
Pick a time window: usually one regular trading session (9:30 AM–4:00 PM ET for ES).
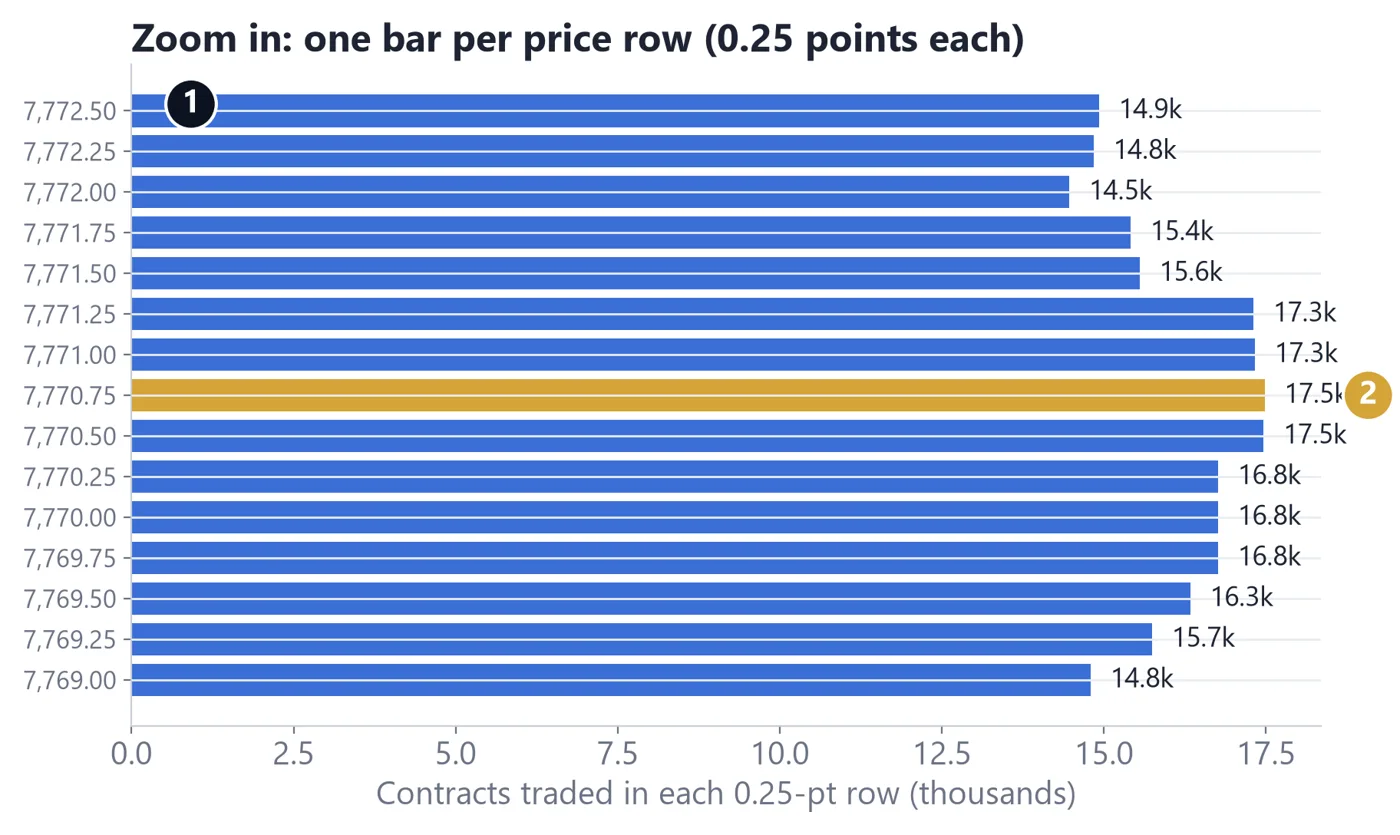
Split price into rows: on ES each row is often one tick, 0.25 points.
Count the contracts traded in each row.
Draw a bar for each row, as long as its volume. The longest bar is the POC.
Figure 1.2. Zoomed in: one bar per 0.25-point row
How to read it
1Each bar is one price row. The number is how many contracts traded there.
2The longest bar (7,770.75) is the Point of Control: the busiest price of the day.
Real ES futures data (Yahoo Finance ES=F, 5-minute bars, regular session 9:30 AM–4:00 PM ET). Volume at price is approximated by spreading each 5-minute bar's volume across the prices it traded through.
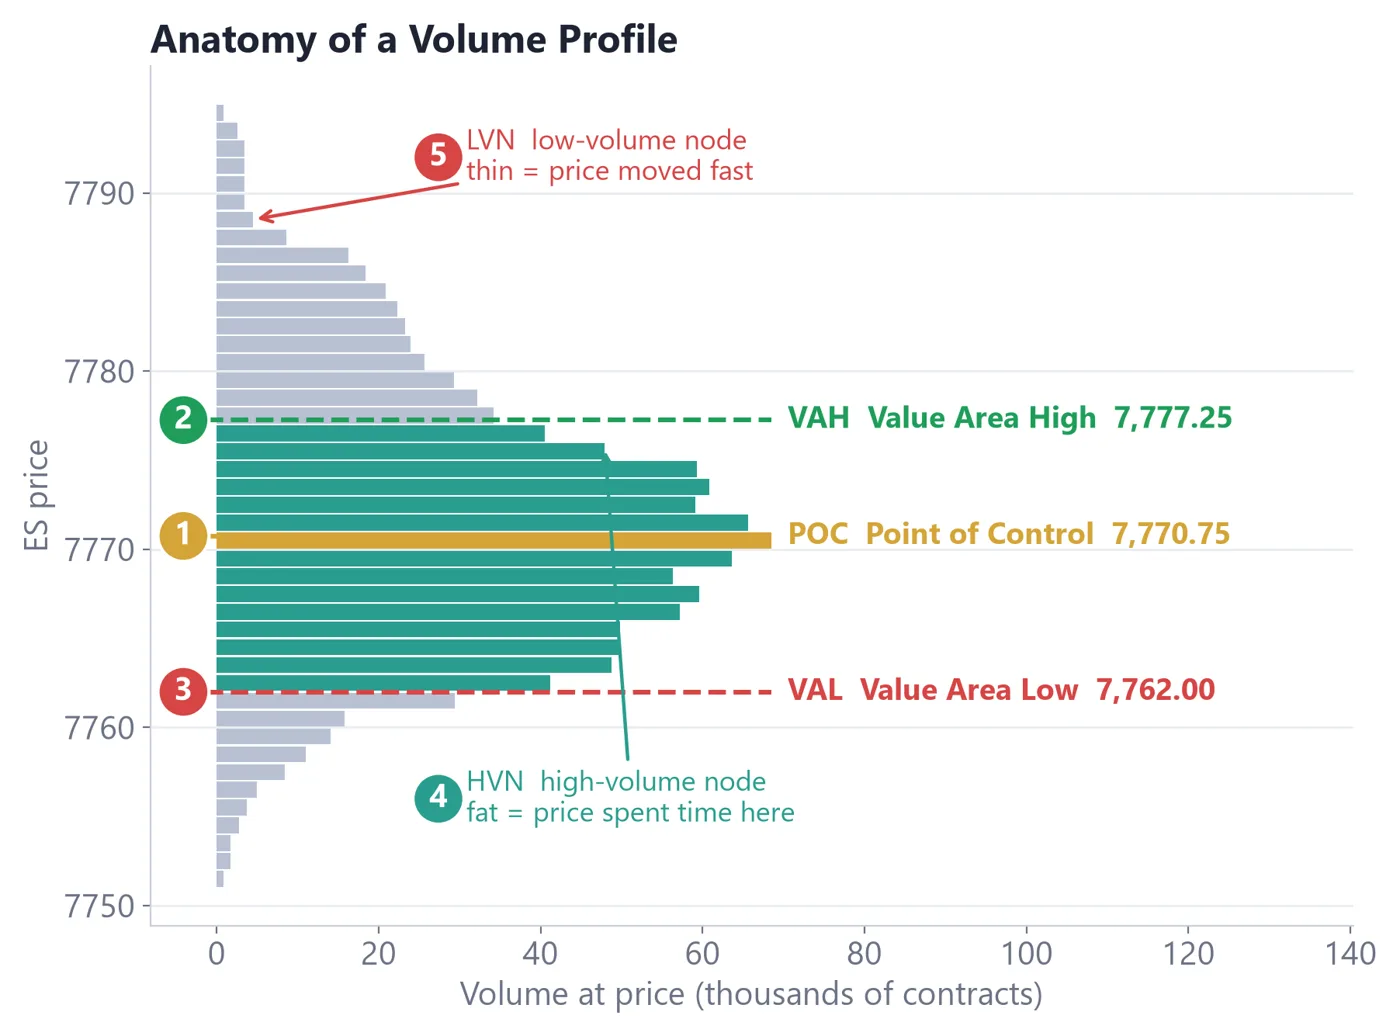
1.3 The five levels to know
Level
What it is
Why traders watch it
POC Point of Control
The single busiest price
The day's 'fair price' reference
VAH Value Area High
Top of the zone holding ~70% of volume
Upper edge of 'accepted' prices
VAL Value Area Low
Bottom of that zone
Lower edge of 'accepted' prices
HVN High-volume node
A fat part of the profile
Price spent time and agreed here
LVN Low-volume node
A thin part of the profile
Price moved through quickly
Figure 1.3. Anatomy of a real profile (ES, Oct 28, 2026)
How to read it
1POC 7,770.75: the busiest price.
2VAH 7,777.25: top of the value area.
3VAL 7,762.00: bottom of the value area.
4HVN: the fat middle, where buyers and sellers agreed.
5LVN: the thin tail, where price passed quickly.
Real ES futures data (Yahoo Finance ES=F, 5-minute bars, regular session 9:30 AM–4:00 PM ET). Volume at price is approximated by spreading each 5-minute bar's volume across the prices it traded through.
Key takeaways
Volume Profile counts volume by price, not time.
The POC is the busiest price; the Value Area holds ~70% of volume.
Fat areas (HVN) = agreement and slow trade. Thin areas (LVN) = fast moves.
Levels are references for attention, never guarantees of a reaction.
LESSON 2 · 10 MIN READ
POC and the Value Area
🎯 You'll learn
How the 70% Value Area is calculated
How traders use yesterday's levels today, including when they fail
What it means when the POC moves during the day
2.1 The Value Area
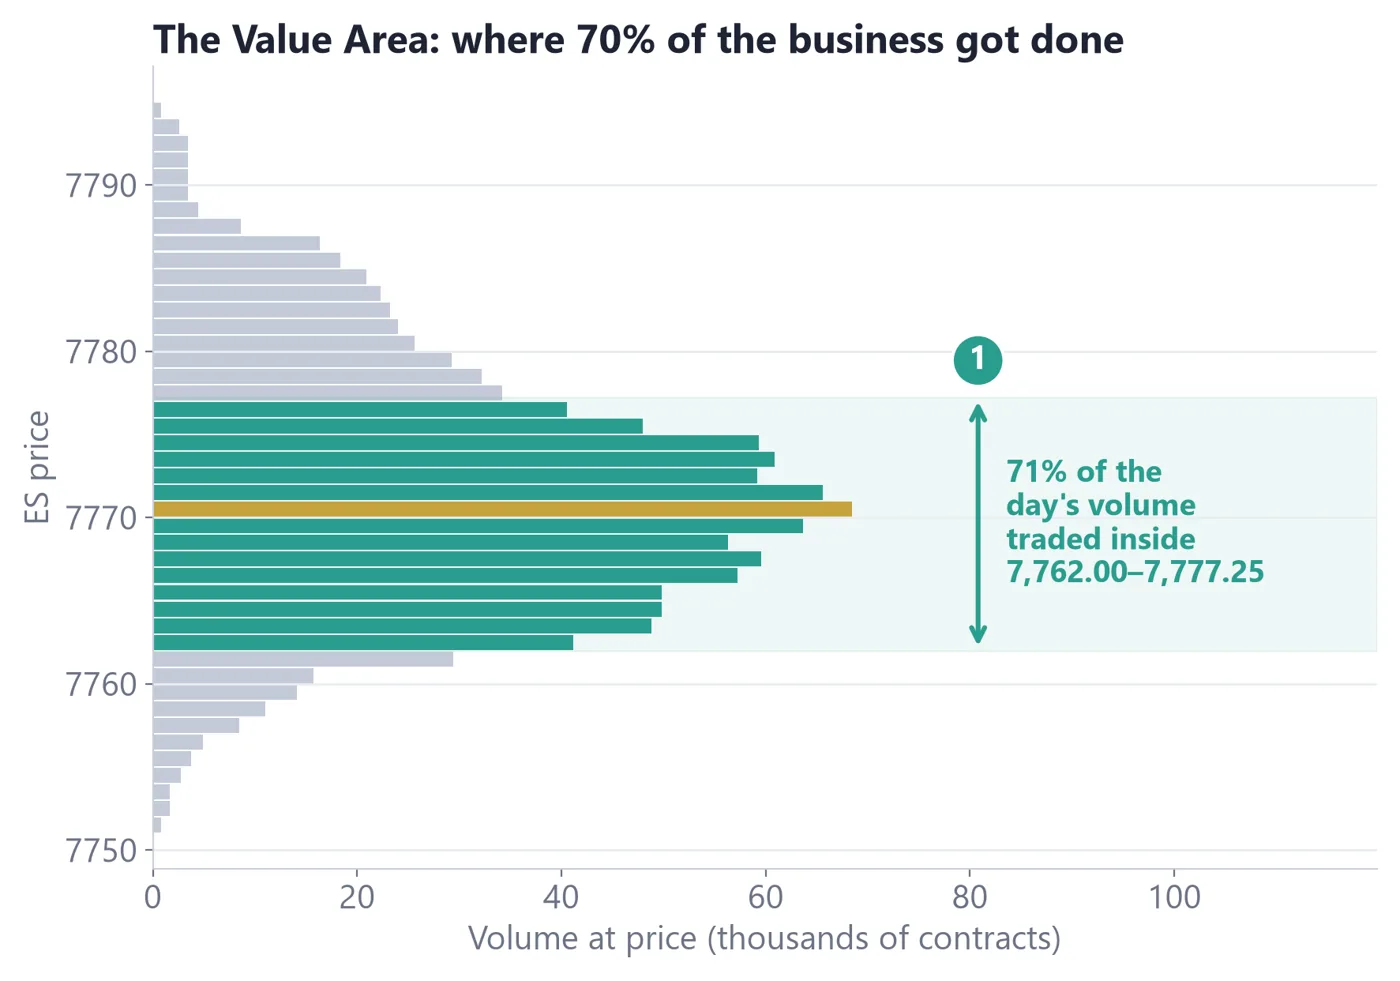
The Value Area is the price range where about 70% of the session's volume traded. The 70% figure is a convention borrowed from statistics (about 68% of a normal distribution sits within one standard deviation). It is a useful rule of thumb, not a law of markets.
Figure 2.1. Where 70% of the business got done (ES, Oct 28, 2026)
How to read it
1The teal band (7,762.00–7,777.25) holds about 70% of the day's contracts.
Real ES futures data (Yahoo Finance ES=F, 5-minute bars, regular session 9:30 AM–4:00 PM ET). Volume at price is approximated by spreading each 5-minute bar's volume across the prices it traded through.
2.2 How it's calculated
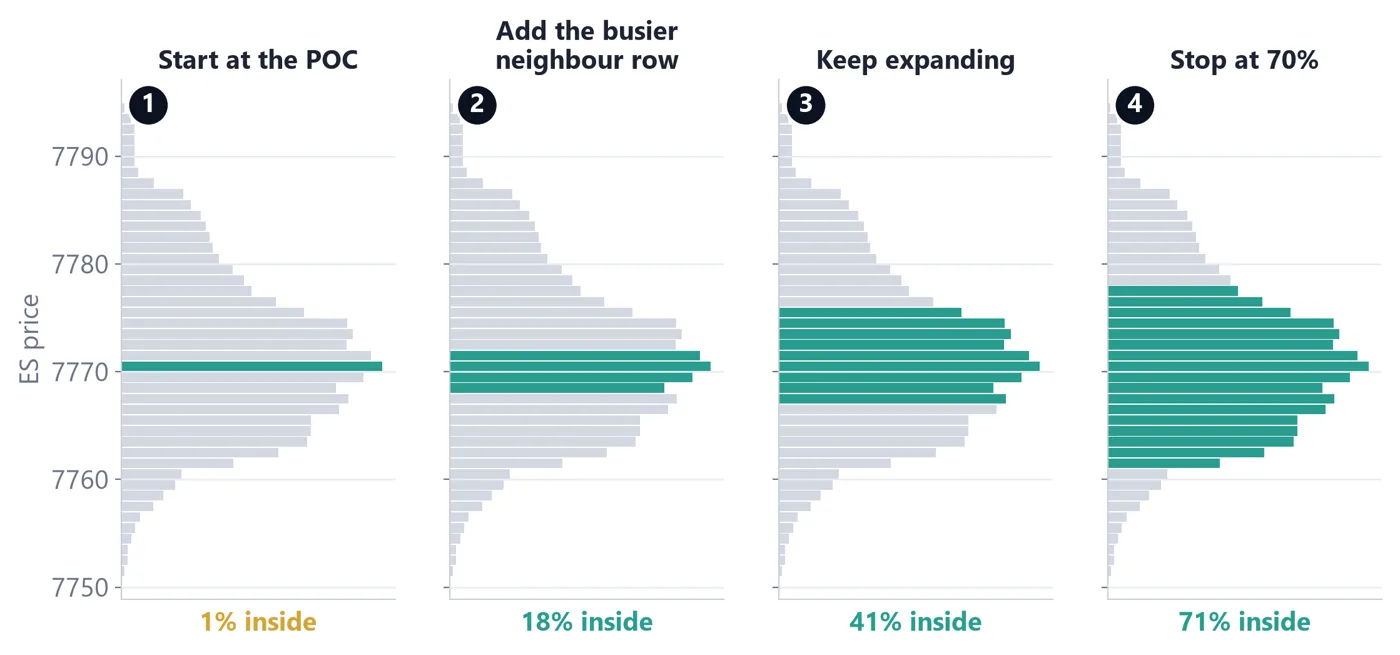
One common method starts at the POC and grows outward, always adding the busier neighbouring row, until 70% of the volume is inside. Some platforms compare two rows at a time, so values can differ slightly between platforms.
Figure 2.2. Building the value area step by step
How to read it
1Start at the POC: about 1% of the volume.
2Add the busier row above or below.
3Keep expanding toward the busier side.
4Stop at 70%. The top and bottom rows are the VAH and VAL.
Real ES futures data (Yahoo Finance ES=F, 5-minute bars, regular session 9:30 AM–4:00 PM ET). Volume at price is approximated by spreading each 5-minute bar's volume across the prices it traded through.
2.3 Using yesterday's levels today
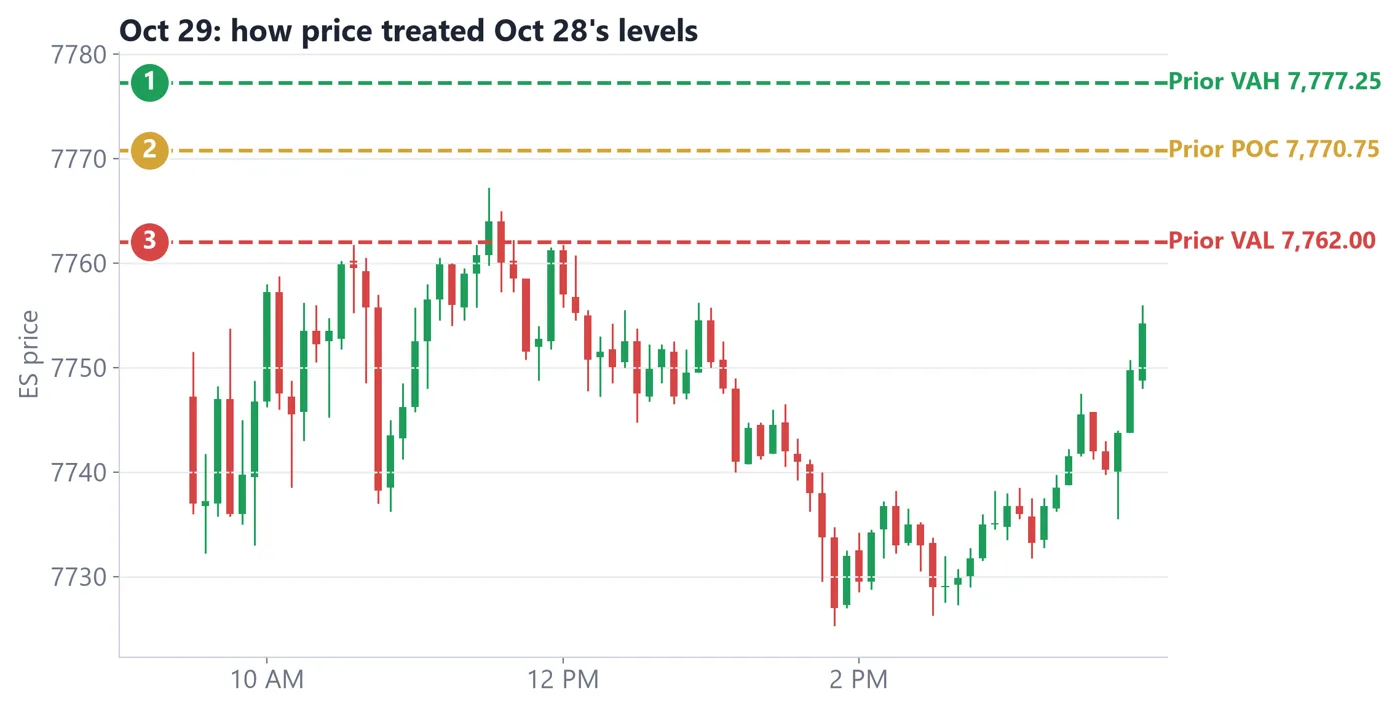
Many traders mark the prior day's POC, VAH and VAL before the open. Where today opens relative to yesterday's value is useful context: inside value often means a calmer, two-sided day; outside value means the market is testing new prices.
Figure 2.3. Oct 29: how price treated Oct 28's levels
How to read it
1Prior VAH 7,777.25: never reached on Oct 29.
2Prior POC 7,770.75: never reached either.
3Prior VAL 7,762.00: price opened below it (7,747.25), poked above it for just 15 minutes around 11:30, then fell to 7,725.25.
Real ES futures data (Yahoo Finance ES=F, 5-minute bars, regular session 9:30 AM–4:00 PM ET). Volume at price is approximated by spreading each 5-minute bar's volume across the prices it traded through.
2.4 POC migration
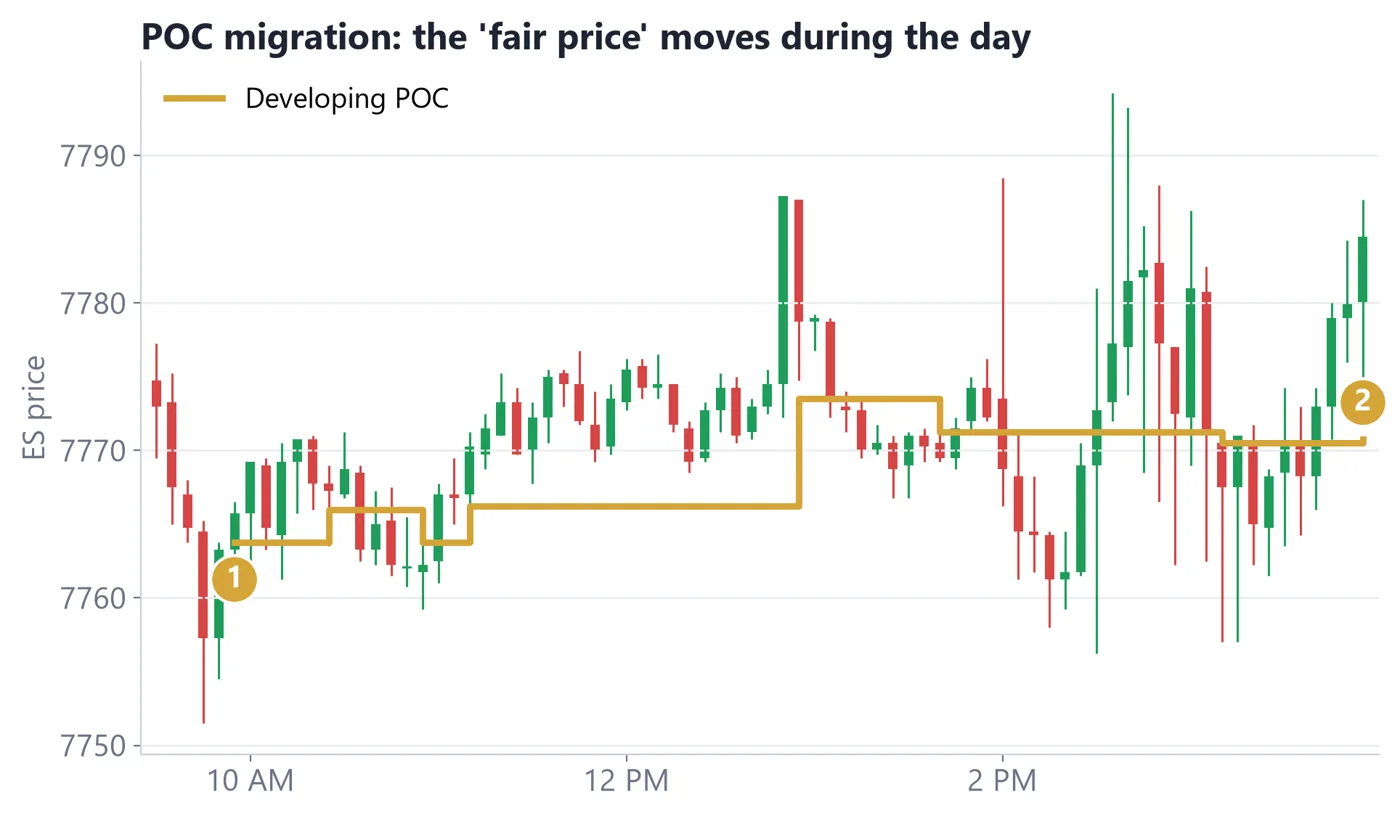
While the session is live, the POC can move. Charting software calls this the developing POC. A POC stepping higher means the busiest trading is happening at higher prices, and vice versa. It tells you how the day is developing, not where it will end.
Figure 2.4. The developing POC on Oct 28, 2026
How to read it
1Early in the day the busiest price sat near the lows.
2By the close the POC had stepped up as trading concentrated higher.
Real ES futures data (Yahoo Finance ES=F, 5-minute bars, regular session 9:30 AM–4:00 PM ET). Volume at price is approximated by spreading each 5-minute bar's volume across the prices it traded through.
Key takeaways
The Value Area is where ~70% of volume traded; VAH and VAL are its edges.
Platforms calculate it slightly differently.
Yesterday's levels give context for today. Price can, and often does, ignore them.
Re-entering value is not acceptance; look for time spent inside.
A migrating POC shows where business is shifting during the day.
LESSON 3 · 10 MIN READ
Reading Profile Shapes
🎯 You'll learn
How to recognise bell, P, b, thin and double-distribution shapes
Why a shape describes what happened, not what happens next
How to label a profile honestly, including when the label turns out wrong
3.1 One day, one shape
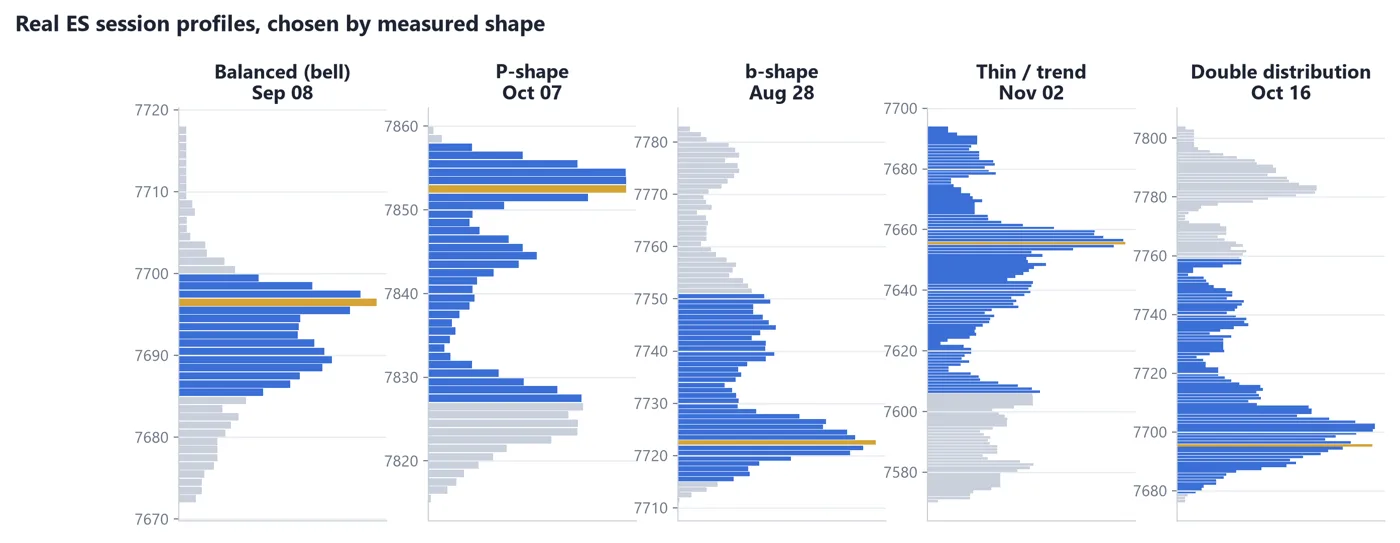
In Lessons 1 and 2 you learned where the busiest price (the POC) and the value area sit. Now zoom out and look at the outline of the whole profile. The outline is called its shape, and it shows how the day's trading was spread across prices.
Shape reading is pattern recognition, not forecasting. A shape tells you how the session unfolded once it is finished, or mostly finished. It does not tell you what the next session will do. Keep that sentence in mind; it will save you from the most common mistake in this lesson.
Five real profile shapes side by side (ES, 5-minute data)
How to read it
1Bell: a fat middle with thin tails on both sides.
2P-shape: the fat part sits near the top of the day's range.
3b-shape: the fat part sits near the bottom.
4Thin and stretched: no big node, volume spread over a long range.
5Double distribution: two fat nodes with a thin gap between them.
Real ES futures data (Yahoo Finance ES=F, 5-minute bars, regular session 9:30 AM–4:00 PM ET). Volume at price is approximated by spreading each 5-minute bar's volume across the prices it traded through.
3.2 The shapes in plain language
A balanced (bell) profile looks like a bell curve. Volume piles up in the middle and fades toward both ends. It is consistent with a session where buyers and sellers largely agreed on a fair price and neither side pushed far.
A P-shape has a fat top and a thin tail pointing down, like the letter P. Most trading happened in the upper part of the range. A b-shape is the mirror image: a fat bottom and a thin tail pointing up. The letters are only a memory trick for where the bulk of volume sits.
A thin or elongated profile has no clear fat node. Price kept moving, so little volume built up at any one level. A double distribution has two separate fat nodes with a thin zone, an LVN, between them. It is consistent with price moving from one area of agreement to another, then settling again.
Shape
What it looks like
Plain description of the session
Bell
Fat middle, thin ends
Two-sided trade around one fair price
P-shape
Fat top, thin tail below
Most business done in the upper part of the range
b-shape
Fat bottom, thin tail above
Most business done in the lower part of the range
Thin / elongated
No dominant node
Price travelled fast; little time at each level
Double distribution
Two nodes, thin gap
Two areas of agreement with a quick move between
3.3 P and b shapes are context, not predictions
You will read in many places that a P-shape is bullish and a b-shape is bearish. That is too strong. A P-shape often forms when a rally is driven by sellers closing out positions, called short covering. When that buying runs out, price can drift or fall back. A P-shape built from short covering often fails to continue higher.
The same is true in reverse for a b-shape. A b-shape can form when buyers are closing out positions, called long liquidation, and a bounce can follow. So treat the letter as a hint about where business was done, then check the next session. Did price stay near that fat node, or leave it behind? What price does next is what tells you whether the shape mattered.
3.4 The trend day profile
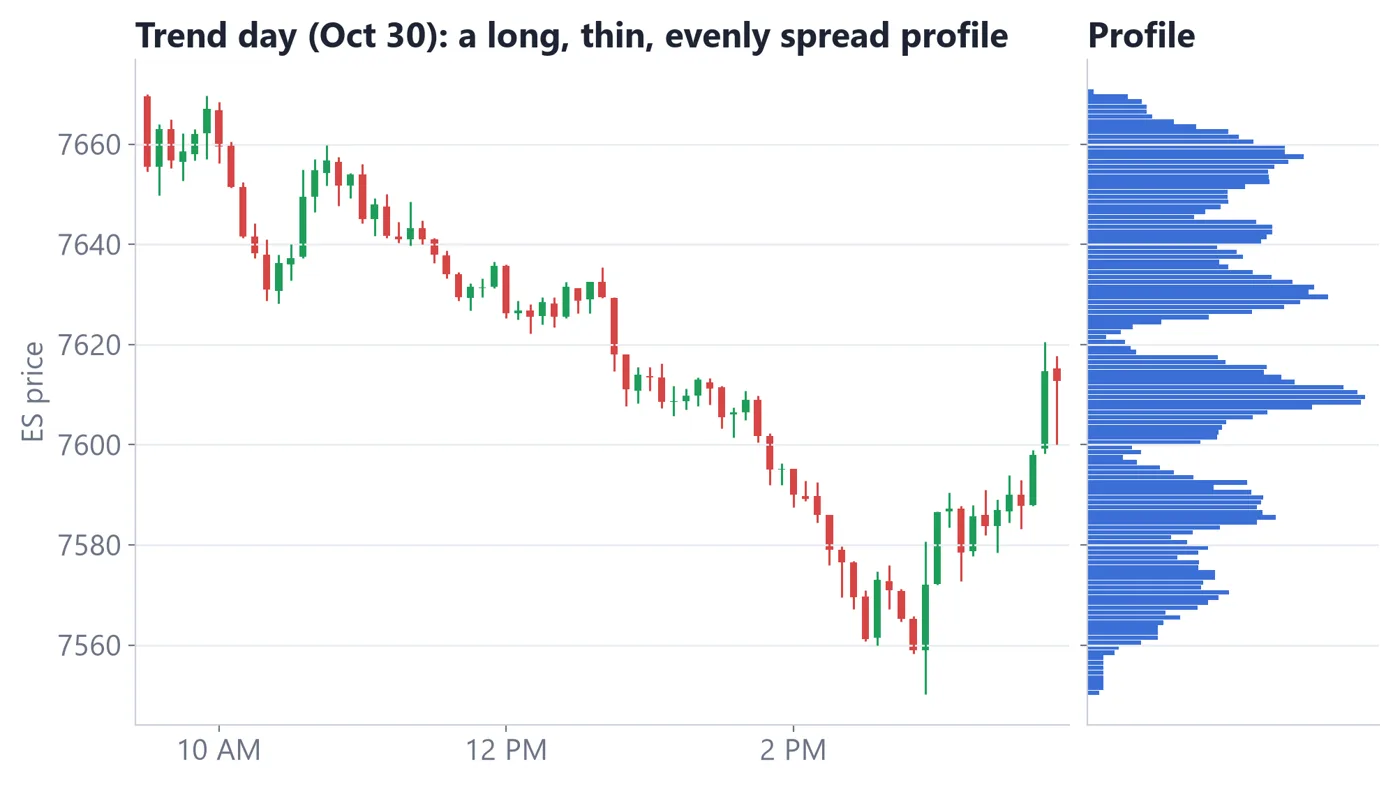
On a strong one-directional day, the profile is usually thin in volume at each price and long in range. October 30, 2026 is a real example: an ES trend day down with an intraday range of about 196 points. Because price kept moving, no single level collected much volume, so the profile is thin and stretched.
Oct 30, 2026: a trend day and its thin, elongated profile
How to read it
1Price travelled in one direction for most of the session.
2Little volume built up at any single price, so there is no clear fat node.
3The POC is a weak guide here, because it was not where the day was decided.
Real ES futures data (Yahoo Finance ES=F, 5-minute bars, regular session 9:30 AM–4:00 PM ET). Volume at price is approximated by spreading each 5-minute bar's volume across the prices it traded through.
A double distribution is not the same thing as a trend day. A trend day is a move that keeps going. A double distribution has a move, then a pause and a new area of agreement, so it forms two nodes. Both involve a fast stretch of price, but the second has a settling phase that creates the second fat node.
3.5 Labelling honestly
Write your label in pencil, not ink. A profile that looks like a P at 1 PM may look like a bell by 4 PM. Decide your label after the session, or mark it 'developing' if you must label during the day.
A simple habit is to log three things: the shape name, where the POC sits in the day's range (top, middle or bottom), and what the next session did around that area. After a few weeks you will have your own record of how often each shape was followed by a continuation and how often by a reversal. Your record is worth more than any rule of thumb you read.
Key takeaways
A profile's shape describes where a session did its business; it does not predict the next one.
P and b shapes are context. A short-covering P often fails to follow through.
A thin, stretched profile (like Oct 30) means the POC was not where the day was decided.
A double distribution is not simply a trend day: it has two areas of agreement.
LESSON 4 · 10 MIN READ
Volume Profile as Support & Resistance
🎯 You'll learn
How HVN and LVN maps are drawn from prior days
Why traders treat nodes as areas of interest, never exact lines
How confluence with prior highs and lows is read, and why it can still fail
4.1 Nodes as places to pay attention
Support is a price area where buyers have stepped in before. Resistance is an area where sellers have. These are loose ideas; a zone is more realistic than a single price. The profile gives you a way to mark those zones from real activity rather than from a guess.
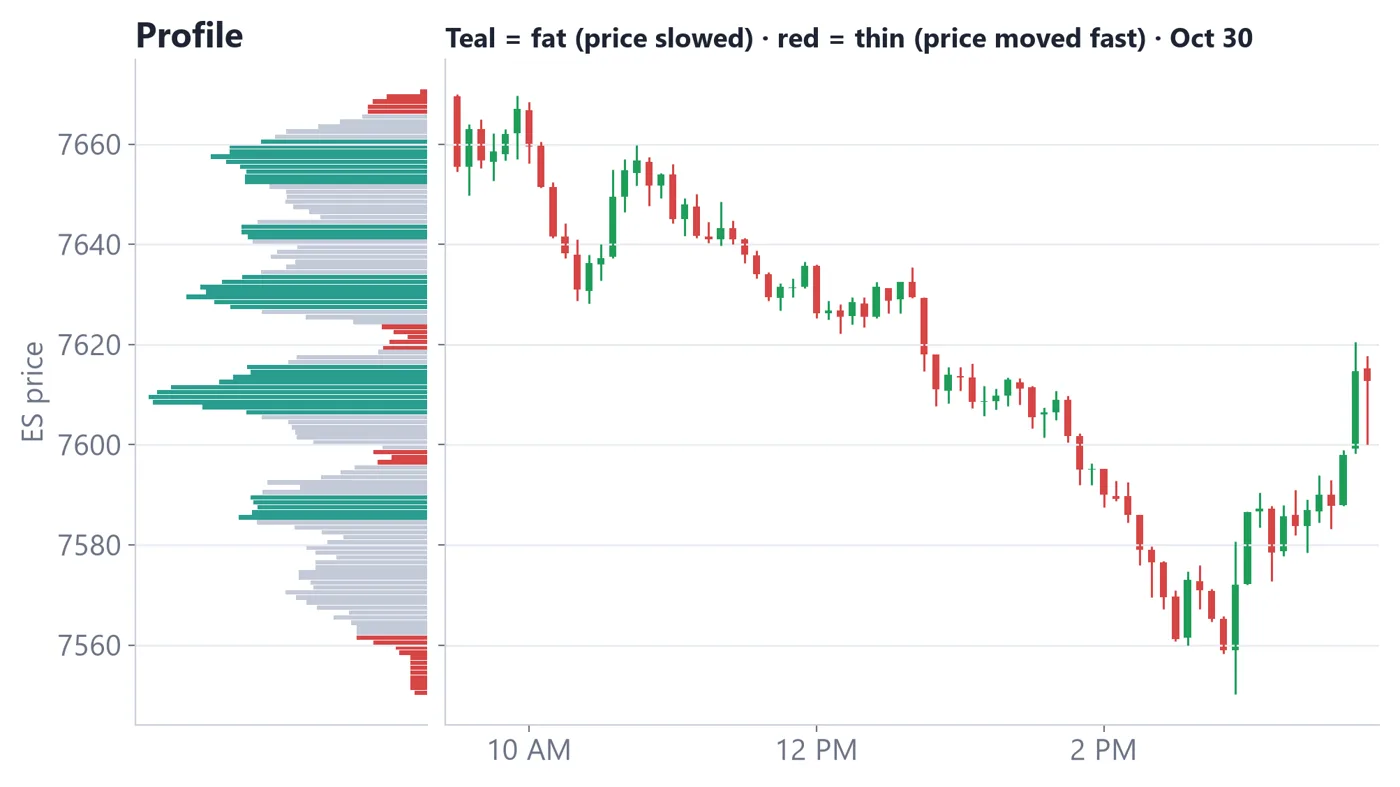
Remember the nodes from Lesson 1. An HVN (high-volume node) is a fat part of the profile where price spent time. An LVN (low-volume node) is a thin part where price moved quickly. Many traders mark both on a map before the session starts.
HVN and LVN map beside the candles
How to read it
1Where the profile is fat (HVN), price slows and moves sideways.
2Where the profile is thin (LVN), price tends to move through quickly.
3One move can pass through several thin zones and pause at the next fat one.
Real ES futures data (Yahoo Finance ES=F, 5-minute bars, regular session 9:30 AM–4:00 PM ET). Volume at price is approximated by spreading each 5-minute bar's volume across the prices it traded through.
4.2 How HVNs and LVNs behave
An HVN is a zone of past agreement. When price returns to it, some traders expect it to slow down or turn into a range again. That is a tendency seen on many charts, not a rule. Price can also slice straight through an HVN when a strong move is underway.
An LVN is a zone where price saw little acceptance. When price returns to an LVN, it often passes through quickly toward the next node. Some traders also watch LVNs as places where a reaction can be sharp, because there is little past business to cushion the move. The reaction can go either way.
Node
Typical behaviour when price returns
What to watch for
HVN
Slowing, chop, a pause
Does price stall, or push through with strong momentum?
LVN
Fast travel through the zone
Does price hurry to the next HVN, or reject and turn back?
POC
Often a pivot or reference
Does price stay near it, or leave and not return?
4.3 Making your map
Mark yesterday's POC, VAH and VAL as zones, not lines. Give each a cushion of a few points.
Scroll the profile back several days and mark the biggest HVNs above and below current price.
Mark the thin LVN gaps between them. Label them 'fast zone'.
Decide in advance what you will watch at each zone: does price stall, reject or accept?
Why build the map before the open? Because decisions made in the middle of a fast move tend to be worse than decisions made calmly beforehand. With a map, you already know which areas matter, so you spend the session watching what price does there instead of hunting for something to do. If nothing happens at your zones, nothing happens, and that is an acceptable day.
A zone of a few points is realistic on ES. A single tick (0.25 points, worth $12.50) is far smaller than the normal noise of a 5-minute bar, so a one-tick line will often be touched, crossed and crossed again. Keep your map to zones.
Oct 29, 2026: prior-day value as a map
How to read it
1Prior VAL of 7,762.00 was a reference; price opened below it at 7,747.25.
2Price traded above 7,762 only between 11:30 and 11:40 (high 7,767.25).
3Then it fell to a low of 7,725.25 at 1:50 PM. The level was visited and did not hold as support from below.
Real ES futures data (Yahoo Finance ES=F, 5-minute bars, regular session 9:30 AM–4:00 PM ET). Volume at price is approximated by spreading each 5-minute bar's volume across the prices it traded through.
4.4 Confluence with prior highs and lows
Confluence means two or more reference points sit in the same area. A common example is a profile node close to the previous day's high or low. Some traders pay extra attention there because several tools point to the same zone.
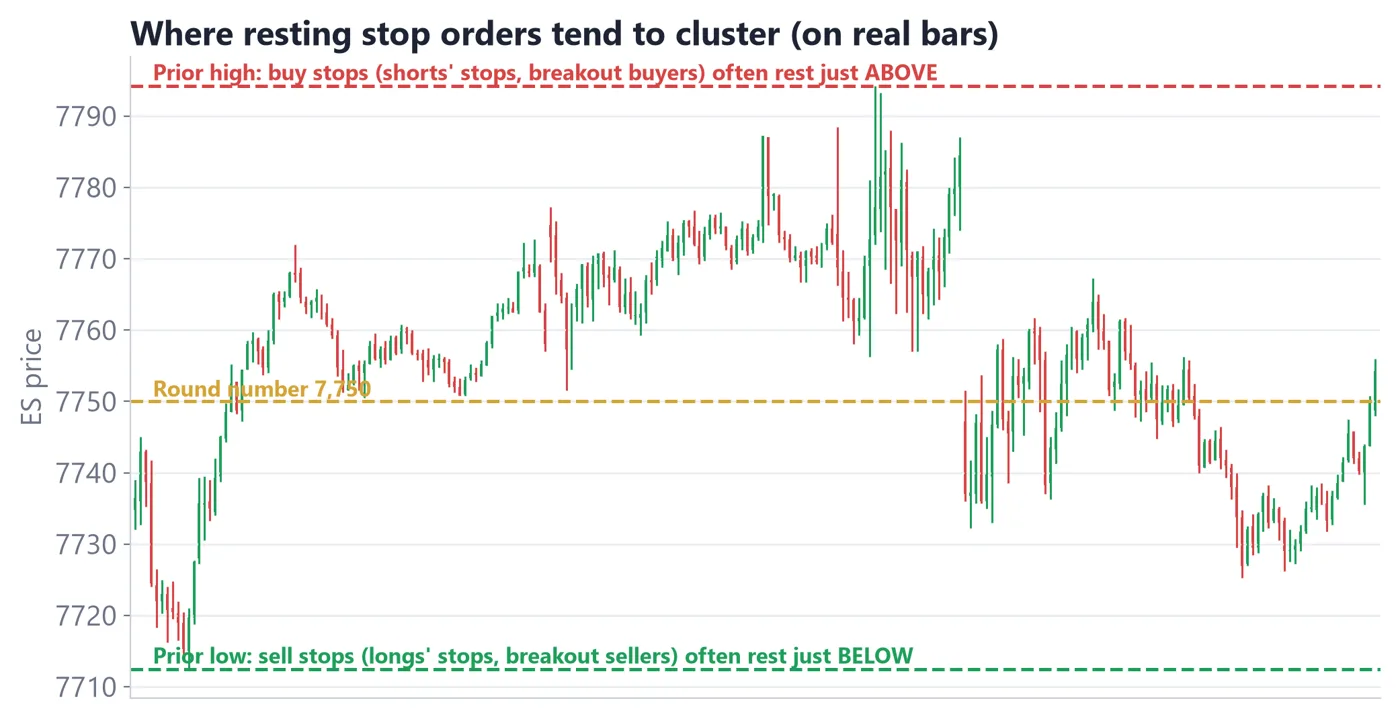
Equal highs, equal lows and a round number
How to read it
1Buy stops tend to sit above prior highs; sell stops tend to sit below prior lows.
2These areas can attract quick, sharp moves as the stops are triggered.
3A node close to one of these areas adds a second reason to watch the zone. It is not a reason to trade it.
Real ES futures data (Yahoo Finance ES=F, 5-minute bars, regular session 9:30 AM–4:00 PM ET). Volume at price is approximated by spreading each 5-minute bar's volume across the prices it traded through.
It also helps to ask what would change your mind. If price pushes through a node and stays on the far side for a while, the node did not act as support or resistance that time. The same node may matter again on another day, or it may not. Write down which one happened so that your map stays honest.
Confluence raises your attention, not your certainty. Two weak reasons do not make a strong one. If a zone had both an HVN and a prior high and price still sliced through it, record that too. A journal of failures is as valuable as a journal of successes.
Key takeaways
HVNs are zones of past agreement; LVNs are zones price moved through quickly.
Treat nodes as zones with a cushion, not single-price lines.
Confluence with prior highs and lows adds attention, not certainty.
Oct 29 shows a prior level can be visited and still fail to hold.
LESSON 5 · 9 MIN READ
Session, Composite and Visible-Range Profiles
🎯 You'll learn
The difference between session, composite and visible-range profiles
How the choice of window changes the POC, VAH and VAL you see
How to pick one window per question and write it down
5.1 Same market, different windows
A volume profile always answers the question 'where did volume trade in this window?' The window is up to you. Change the window and the profile, including the POC and value area, changes with it. Neither answer is wrong; they answer different questions.
Think of it as choosing a lens. A wide lens shows the large areas the market keeps returning to. A narrow lens shows what happened today. Using the wrong lens is a common reason two traders look at the same market and disagree about where 'the' POC is.
Three windows appear on almost every platform. Learn what each is for, then pick one per question rather than switching until you find a picture you like.
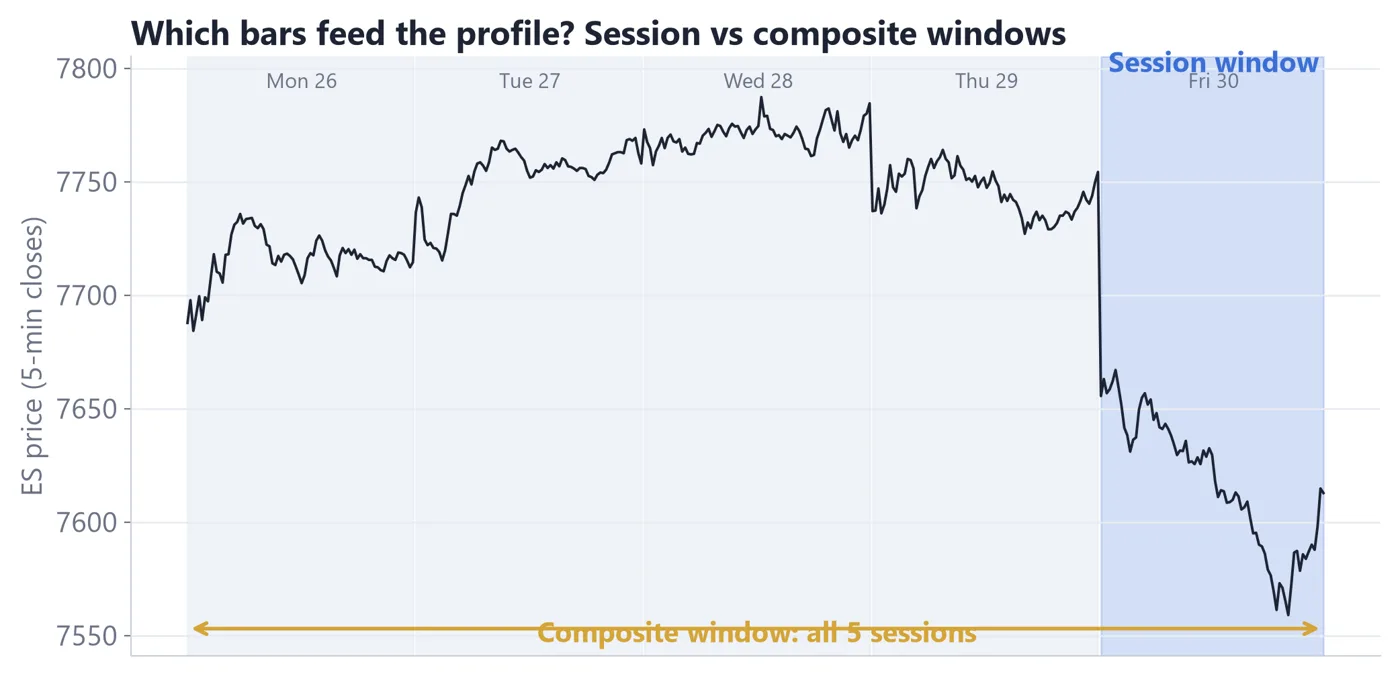
Three windows boxed on one multi-day chart
How to read it
1Session: one trading day, for today's story.
2Composite: several days merged, for the bigger picture.
3Visible range: whatever is on your screen, for a quick read of the picture in front of you.
Real ES futures data (Yahoo Finance ES=F, 5-minute bars, regular session 9:30 AM–4:00 PM ET). Volume at price is approximated by spreading each 5-minute bar's volume across the prices it traded through.
5.2 The three windows
Profile
Window
Best used for
Watch out for
Session
One trading day (RTH 9:30 AM to 4:00 PM ET)
Yesterday's POC, VAH and VAL; the day's shape
Single days can be noisy
Composite
Several days merged into one profile
The market's larger agreed areas
Which days to include is a choice
Visible range
Everything currently on screen
A fast read while exploring
Changes as you scroll or zoom
A session profile is the one you have used so far. It is the right choice for 'where was fair price yesterday?' and for studying a single day's shape.
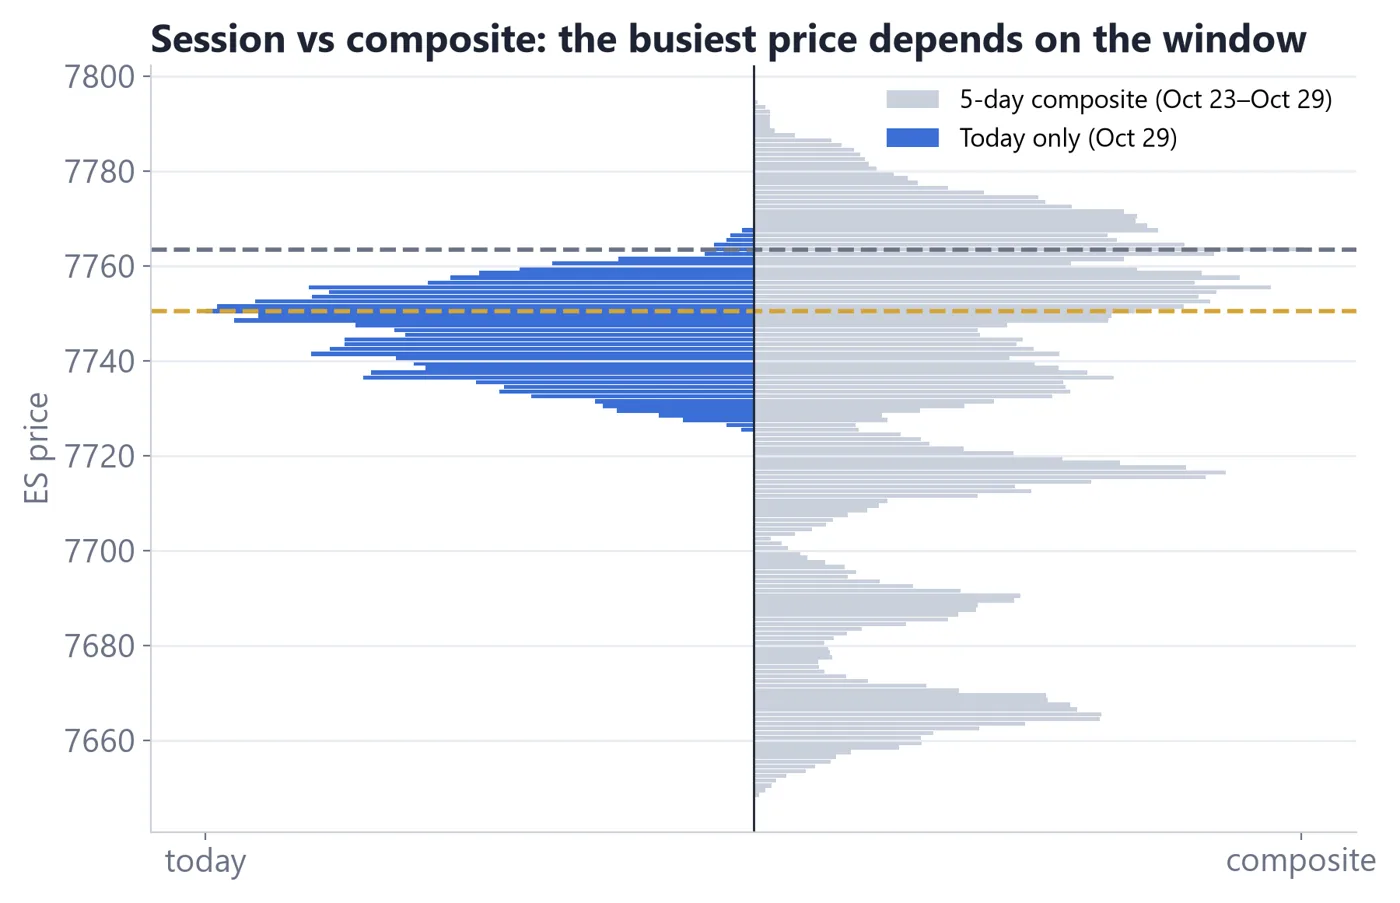
A composite profile adds several sessions together. It reveals larger areas of agreement that no single day shows clearly. A composite of five or ten days often has a steadier POC than any one session.
A visible-range profile builds itself from whatever bars are on your screen. It is quick and flexible, but its levels move when you scroll. Do not draw conclusions about levels from a profile that changes every time you pan the chart.
Today's session profile vs a 5-day composite
How to read it
1The session POC marks today's busiest price.
2The composite POC marks the busiest price across all five days.
3Check whether the two agree. When they differ, you have two reference points to write down.
Real ES futures data (Yahoo Finance ES=F, 5-minute bars, regular session 9:30 AM–4:00 PM ET). Volume at price is approximated by spreading each 5-minute bar's volume across the prices it traded through.
5.3 Choosing a window and sticking to it
A good rule is to attach a window to each question. 'Where did yesterday trade?' uses the session profile. 'Where has this market done most of its business over the last two weeks?' uses a composite. 'What is the shape of this move I am looking at?' uses the visible range.
Then write the window down next to the level. A note that says 'POC 7,770.75' is incomplete. A note that says 'session POC, Oct 28, 7,770.75' is something you can check later. That Oct 28 session had a value area from a VAL of 7,762.00 to a VAH of 7,777.25 around that POC.
Here is a small worked comparison. Imagine the session POC for the last day sits at one price, but the ten-day composite POC sits several points higher. The session tells you where yesterday's business was done. The composite tells you where the market has done most of its business over a longer stretch. If price opens near the composite POC, the larger area of agreement is in play; if it opens far from it, price is trading in less-visited territory. You describe that, you do not predict from it.
Be careful with composites. If a one-off event day (very large or very thin) is included, it can distort the whole profile. Look at the individual days inside your composite before you trust the combined levels. Also remember that the number of days is your choice; five days and fifteen days can give different POCs from the same market.
Key takeaways
The window you choose changes the POC and value area you see.
Session = one day; composite = several days; visible range = whatever is on screen.
Pick the window to match the question, and write it down.
Check the individual days inside a composite before trusting it.
LESSON 6 · 12 MIN READ
Putting It Together: Study Frameworks
🎯 You'll learn
A step-by-step study routine using prior-day levels
How to do the risk maths in ticks, points and dollars on ES
How to study one hypothetical that fails and one that is skipped
6.1 A study routine, not a signal
This lesson ties Lessons 1 to 5 into a simple routine. Everything here is an illustrative framework for study. It is not a recommendation to trade and it does not predict results. Real trading involves slippage, gaps and the possibility of losing more than you plan.
Morning study routine
11. Mark yesterday's session POC, VAH and VAL
22. Mark the nearest HVNs and LVNs from the last few days
33. Note where today opens: inside or outside value
44. Write what would count as acceptance and what as rejection
55. Decide your risk in dollars before you look at any entry
66. If risk, reward or context is unclear, write 'no trade' and skip
The last step matters. Skipping a setup is an action you can take every day. A study framework that never says 'skip' is not a framework.
6.2 The risk maths on ES
Futures risk is simple arithmetic once you know the contract. On ES, 1 point = $50 and 1 tick (0.25 points) = $12.50 per contract. Risk is the distance from entry to your stop, times the dollar value, times the number of contracts.
Distance
Ticks
Dollars per contract
1 point
4
$50
4 points
16
$200
8.75 points
35
$437.50
14.75 points
59
$737.50
Reward-to-risk compares the distance to your target with the distance to your stop. A 4-point stop (16 ticks, $200) with an 8.75-point target (35 ticks, $437.50) has a reward-to-risk of about 2.2 to 1. That is only arithmetic; it says nothing about how often the target is reached.
6.3 Hypothetical example 1: a framework that fails
Hypothetical example. This uses the real levels from Oct 28 and Oct 29, 2026, but the trade itself is invented for study and was not taken.
Oct 28's value area was VAL 7,762.00 to VAH 7,777.25, with a POC of 7,770.75. On Oct 29 price opened at 7,747.25, below the prior VAL. Suppose a student writes the plan: 'If price trades back above VAL, buy with a target of the prior POC and a stop 4 points below the VAL.'
Item
Value
Entry (hypothetical)
7,762.00
Stop
7,758.00 (4 points, 16 ticks, $200 per contract)
Target
7,770.75 (8.75 points, 35 ticks, $437.50)
Reward-to-risk
about 2.2 to 1
What happened: price traded above 7,762 only between 11:30 and 11:40, reaching a high of 7,767.25. It never reached the target. It later fell to 7,725.25 at 1:50 PM and the day closed at 7,754.25. The hypothetical stop would have been hit for a loss of about $200 per contract, before slippage.
Lesson: re-entry into value was not acceptance. The Lesson 2 note about time spent inside value applies. A written plan that required time inside value (two 30-minute periods is a common convention) would have kept the student out.
The failed re-entry on Oct 29
How to read it
1Price opened below prior VAL (7,747.25).
2It poked above 7,762 for ten minutes, high 7,767.25, and never reached the 7,770.75 POC.
3The later low of 7,725.25 shows what 'no acceptance' looked like.
Real ES futures data (Yahoo Finance ES=F, 5-minute bars, regular session 9:30 AM–4:00 PM ET). Volume at price is approximated by spreading each 5-minute bar's volume across the prices it traded through.
6.4 Hypothetical example 2: a setup that is skipped
Hypothetical example. Same day, a different student marks the entry at 7,762.00 but places the stop below the day's open, at 7,747.25, because that is where the idea is clearly wrong. That stop is 14.75 points (59 ticks), or $737.50 per contract.
The target is still the prior POC at 7,770.75, 8.75 points away. Reward-to-risk is 8.75 divided by 14.75, about 0.6 to 1. The student's rule says to require at least 1.5 to 1, so the verdict is skip. No order is placed. The day later fell to 7,725.25, so skipping avoided a loss, but that was partly luck; the correct reason to skip is the arithmetic.
Skipping is not a failure. It is the result of a rule applied consistently. Write it in your journal as a plain 'no trade: reward 8.75 points vs risk 14.75 points'.
6.5 Sizing and the journal
Decide the dollar risk first. If your plan allows $200 of risk and the stop is 4 points ($200 per contract), the size is one contract. If the stop is 14.75 points ($737.50), one ES contract already exceeds the plan, so the answer is to skip or to use a smaller contract such as Micro E-mini S&P 500 (one tenth the size). Check the exchange specifications for its tick value.
Key takeaways
A framework is a study routine; it ends in 'trade' or 'skip', and skip is normal.
On ES: 1 point = $50, 1 tick = $12.50. Work risk out in dollars before entry.
Re-entering value is not acceptance; the Oct 29 hypothetical shows how a plan fails.
Reward-to-risk is arithmetic about distances, not a forecast of how often a target is hit.
LESSON 7 · 9 MIN READ
Understanding Market Profile (TPO)
🎯 You'll learn
What a TPO letter profile is and how each letter is built
How the Initial Balance, POC and value area appear on a TPO chart
How a TPO profile differs from a volume profile, and why to use both
1.1 Time at price
Lessons 1-6 counted volume at each price. Market Profile counts something simpler: time at each price. Instead of asking how many contracts traded, it asks how long price spent at each level. The result is a sideways stack of letters that looks like a bell, a lopsided bell or something stranger.
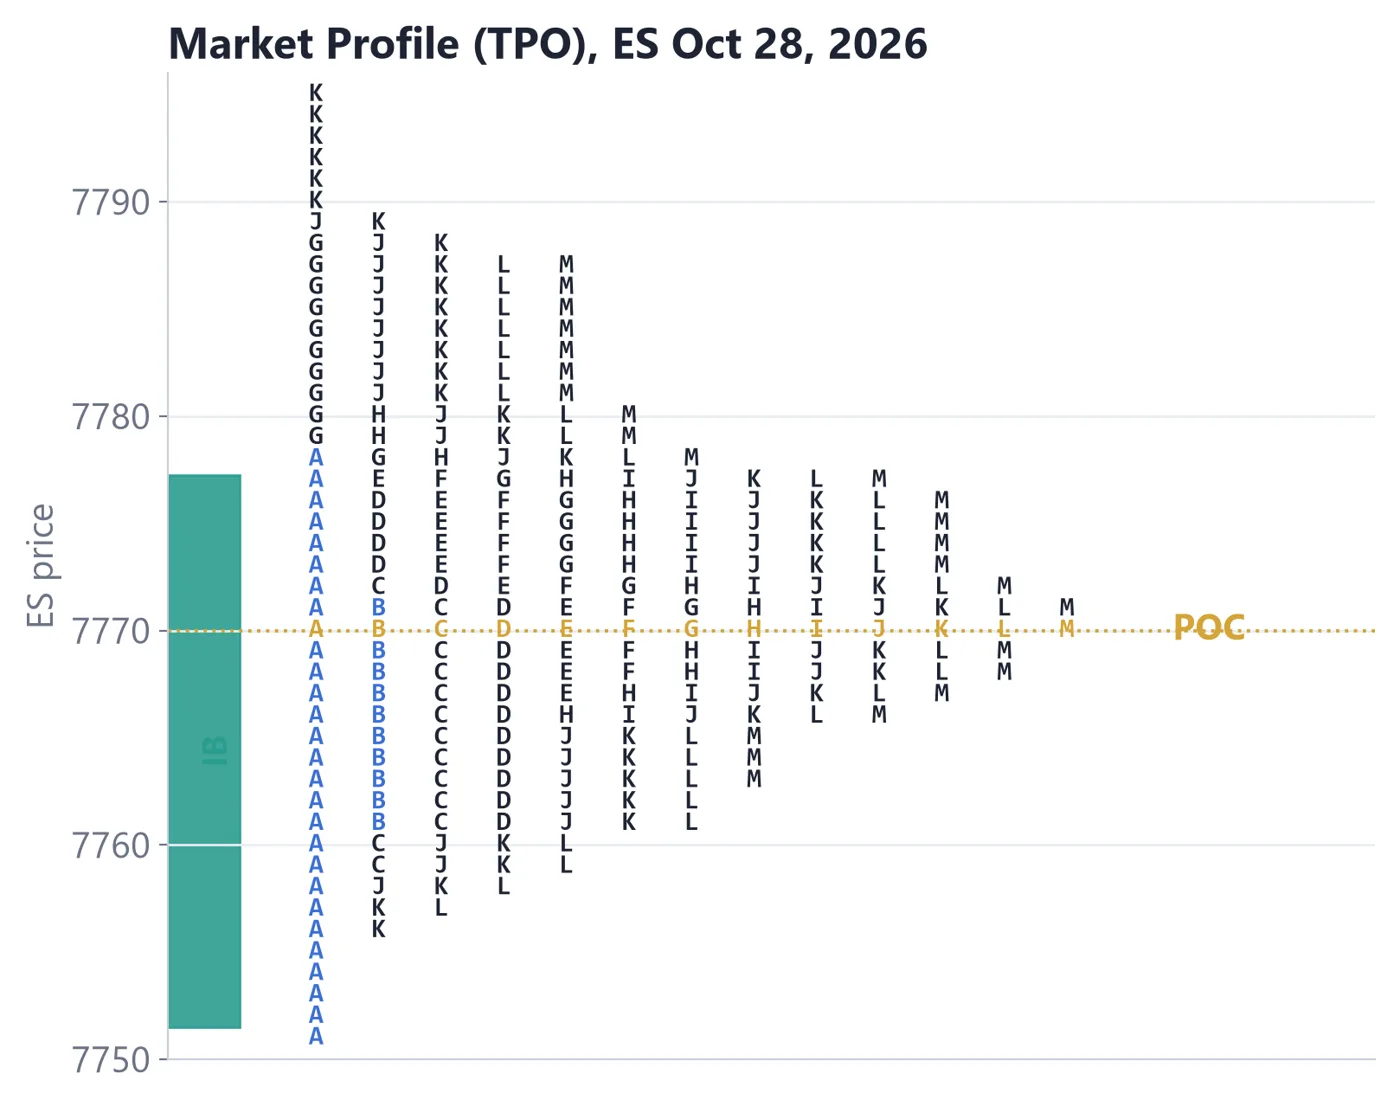
Here is how it is built. The regular session (9:30 AM to 4:00 PM ET) is cut into 30-minute periods. Each period gets a letter: A for 9:30 to 10:00, B for 10:00 to 10:30, and so on. For every period, you place that letter at each price the market touched. Each placed letter is called a TPO, short for Time Price Opportunity. Where many letters stack up, price spent a lot of time.
A real TPO profile for Oct 28, 2026 (ES)
How to read it
1Each row is a price. Each letter shows a 30-minute period that traded there.
2The longest row is the TPO point of control (POC): the price with the most letters.
3The first two letters, A and B, make up the Initial Balance, the first hour of trading.
4The wide middle holds roughly 70% of the letters: the value area.
Real ES futures data (Yahoo Finance ES=F, 5-minute bars, regular session 9:30 AM–4:00 PM ET). Volume at price is approximated by spreading each 5-minute bar's volume across the prices it traded through.
1.2 Reading the letters
Read a TPO chart from left to right in time and bottom to top in price. Letters at the far left are early; letters at the far right are later. A single letter standing alone on a row is a single print. It means price moved through that level in one period and did not return. Single prints often mark fast, one-sided movement.
Feature
What it is
Why traders look at it
TPO count
How many letters sit at a price
Shows where price spent the most time
TPO POC
The row with the most letters
A reference for fair price by time
Value area
Rows holding about 70% of the letters
The range where most time was spent
Initial Balance
Range of the first hour (letters A and B)
Sets the early frame for the day
Single prints
Rows with only one letter
Quick moves with little time spent
A quick example of reading the shape: if the letters pile up in the middle and thin out above and below, the day spent most of its time around one price. If the letters keep marching higher with each new letter, price was moving rather than resting. The order of the letters tells the story of the day, which is something a volume profile alone does not show.
Notice that these are the same ideas as in Guide 1: a most-visited price, a 70% zone, and thin areas. The vocabulary is shared. What changes is the thing counted: letters (time) instead of contracts (volume).
1.3 TPO versus volume profile
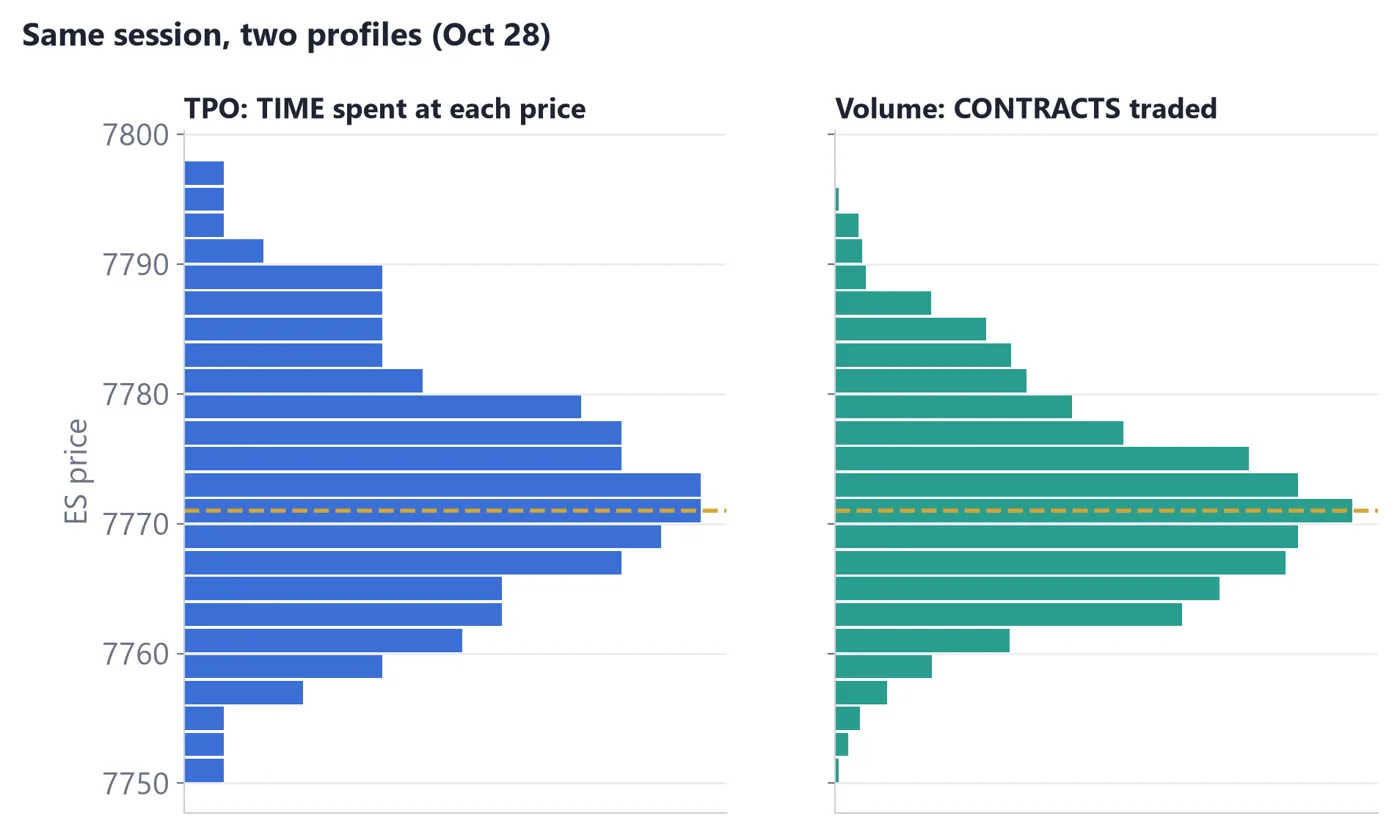
Time and volume often agree, but not always. A price where the market lingered quietly gets many letters but modest volume. A price where heavy trading happened in a few minutes gets few letters but large volume. Looking at both on the same day shows you which kind of agreement the market showed.
Same day: TPO profile beside the volume profile
How to read it
1Where both profiles are fat, time and volume agree.
2Where the TPO is fat and the volume is thin, price lingered on little business.
3Where the volume is fat and the TPO is thin, heavy trading happened quickly.
Real ES futures data (Yahoo Finance ES=F, 5-minute bars, regular session 9:30 AM–4:00 PM ET). Volume at price is approximated by spreading each 5-minute bar's volume across the prices it traded through.
Neither is more correct. Market Profile has been used since the days of floor trading, and its structure of lettered periods makes the day's story easy to read from the chart alone. The volume profile adds the participation level. The first is built from the clock; the second from the tape.
In the rest of this guide we use the TPO profile to read the shape and structure of the day: how the market opened, how the first hour set the frame, and where value was built. You do not need Guide 1 to follow, but if you want a refresher on value area and POC, Lessons 1 and 2 of Guide 1 cover them.
Key takeaways
Market Profile stacks lettered 30-minute periods at each price to show time spent.
The TPO POC, value area and single prints are the main features to read.
Time and volume often agree, and when they differ, that difference is informative.
The Initial Balance (letters A and B) frames the first hour of the day.
LESSON 8 · 10 MIN READ
Auction Market Theory
🎯 You'll learn
Why the market can be seen as a continuous two-way auction
The difference between balance and imbalance, and responsive and initiative activity
How top-down context from prior days frames today
2.1 The market as an auction
Auction Market Theory is a way of thinking, not an indicator. Its core idea is that a market exists to facilitate trade. Price moves higher to look for more buyers' interest, and lower to look for more sellers' interest. When it finds a price where trade flows easily in both directions, it tends to stay near that price. When it stops finding willing counterparties, it moves again.
Think of an ordinary auction. The auctioneer calls out higher prices until buyers drop out. If no one bids, the price drops until someone does. Price is not 'right' or 'wrong'; it is the market's way of finding where business gets done.
2.2 Balance and imbalance
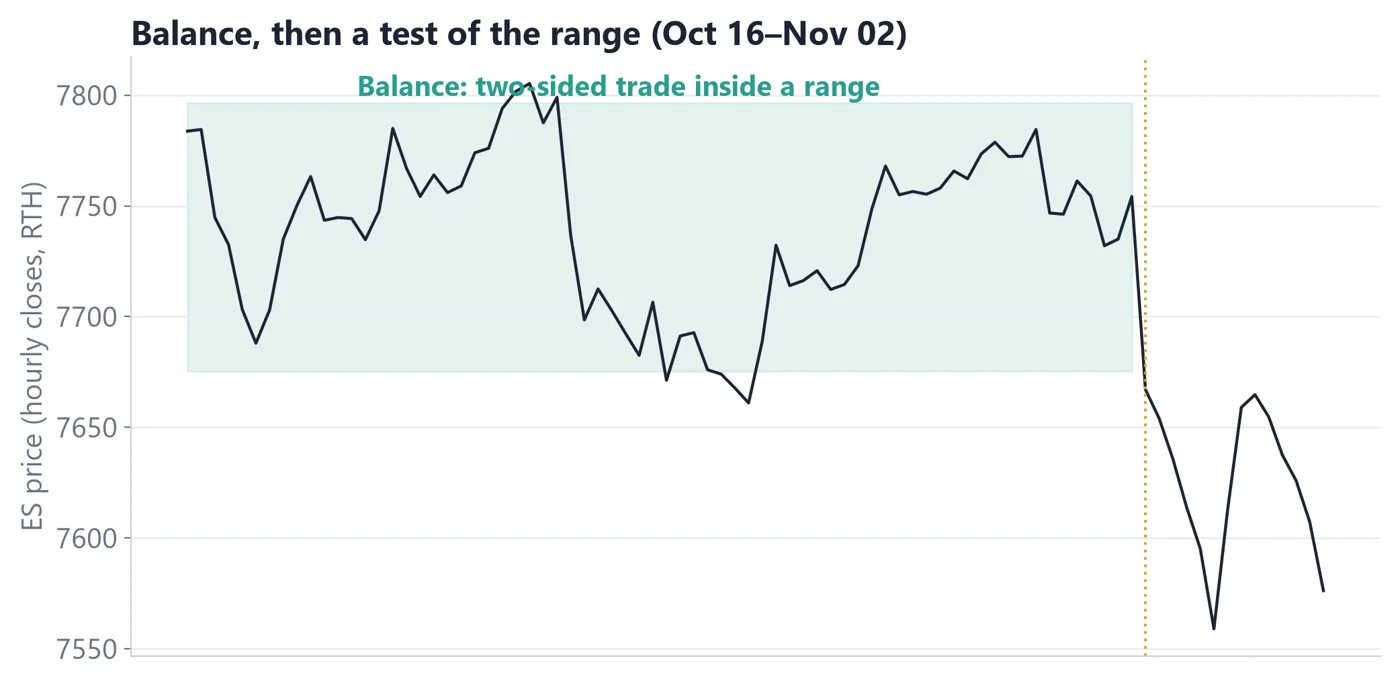
Auction Market Theory describes two main states. In balance, price rotates inside a range and builds overlapping value. Profiles tend to look like a bell, and each day's value area overlaps the previous one. In imbalance, one side dominates and price moves out of the range to find new value. Value areas move higher or lower from day to day.
A multi-day balance range, then a break
How to read it
1The shaded zone is a balance: several days of overlapping trade.
2Price leaves the range, which is a possible move into imbalance.
3Look at whether new trade builds up at the new prices (acceptance) or price returns to the range (rejection).
Real ES futures data (Yahoo Finance ES=F, 5-minute bars, regular session 9:30 AM–4:00 PM ET). Volume at price is approximated by spreading each 5-minute bar's volume across the prices it traded through.
These states are not predictions. Balance can last two days or two months. A move out of balance can hold or fail. What the framework gives you is a plain question to ask every day: is the market rotating in a range, or is it looking for new value?
2.3 Responsive versus initiative
Auction Market Theory also describes two kinds of activity. Responsive activity is trade that pushes price back toward value after it has moved away, such as buying below value or selling above it. Initiative activity is trade that pushes price away from value into new territory, such as buying above the prior high or selling below the prior low.
Type
What it looks like
What it says about the auction
Responsive
Trading back toward value after a move away
The move away found little interest
Initiative
Trading away from value into new prices
Participants are willing to pay (or accept) new prices
Initiative activity needs follow-through to matter. If price pushes above a prior high and then falls straight back, the initiative attempt was rejected. If price pushes above and builds value there, it was accepted.
2.4 Open types and the first minutes
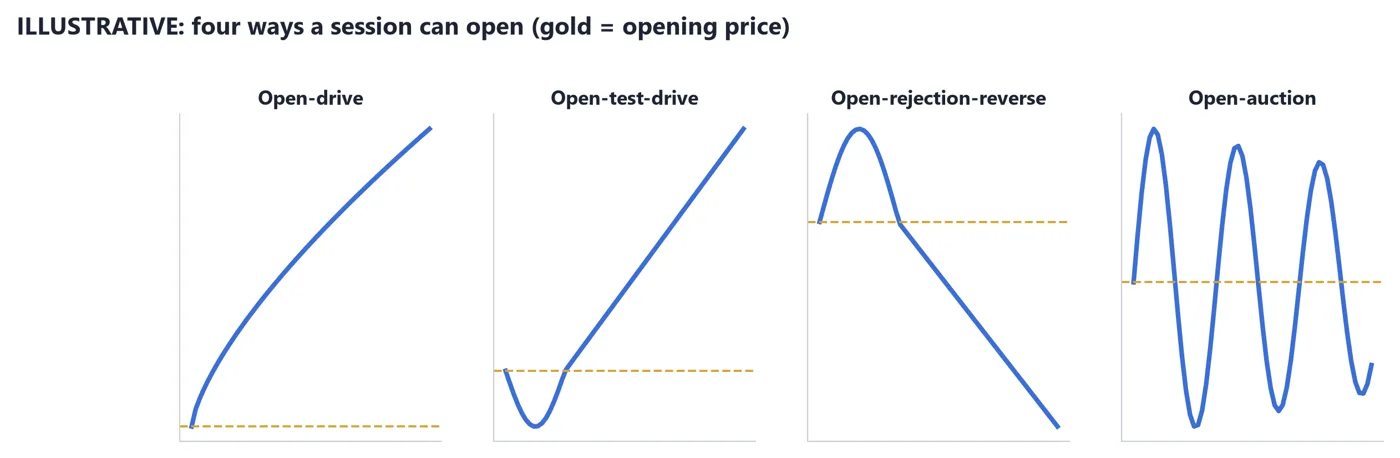
How a day opens relative to prior value gives early context. Some traders classify the open: a fast drive in one direction, a test followed by a drive, a rejection and reversal, or a rotation inside the prior range. The sketch below illustrates the four commonly named open types. Treat them as descriptions of the first minutes, not signals.
Four open-type sketches (illustrative)
How to read it
1Open-drive: price moves in one direction from the start and does not come back.
2Open-test-drive: price tests one side first, then drives the other way.
3Open-rejection-reverse: price moves one way, then reverses through the open.
4Open-auction: price rotates inside the prior range.
Illustrative diagram for teaching. Not real market data.
2.5 Top-down context
Top-down means you start with the big picture and work in. First: where is price relative to the multi-day balance range? Second: where did yesterday's value form, and where did today open relative to it? Third: what type of open and early range do you see? Only then do you look at the detail.
On Oct 29, 2026, for example, the open was 7,747.25, below the prior day's VAL of 7,762.00. That is context: the market opened outside the previous value. It did not tell anyone what would happen; price traded above 7,762 only for a few minutes and later reached 7,725.25. The context framed the questions, and the day answered them.
Key takeaways
Auction Market Theory treats the market as a search for prices where trade flows both ways.
Balance means overlapping value; imbalance means the market is looking for new value.
Responsive activity returns to value; initiative activity leaves it, and needs follow-through.
Start with context from the multi-day range and prior value, then work in to the detail.
LESSON 9 · 10 MIN READ
Profile Patterns and Day Types
🎯 You'll learn
The four common day types: normal, normal variation, trend and double distribution
How each type is described by its profile and its opening range
Why a day type is a label applied afterwards, and what its limits are
3.1 Why day types exist
Not every day looks the same. Market Profile traders group days into types based on how the profile develops. The groups help you describe a session, compare it with past ones and notice when something unusual is happening. Guide 1 introduced profile shapes (bell, P, b, thin, double). Here we look at how those shapes relate to the structure of the day.
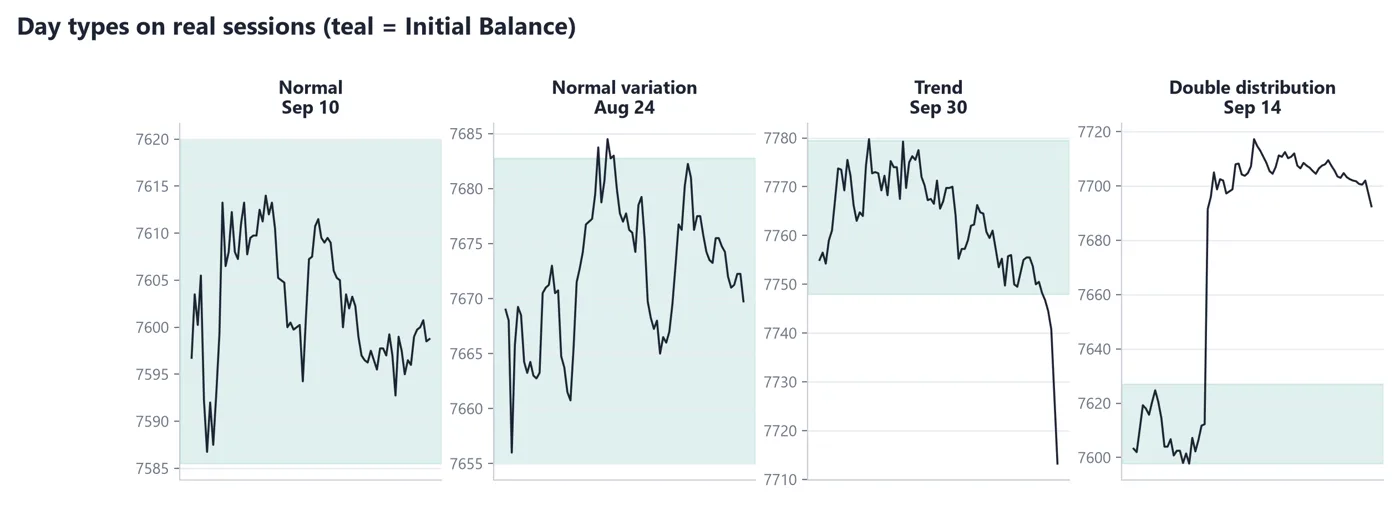
Four real mini-days: normal, normal variation, trend and double distribution
How to read it
1Normal: most of the day stays inside the first hour's range.
2Normal variation: the day pushes outside the first hour's range on one side.
3Trend: price moves in one direction for most of the session.
4Double distribution: two areas of trade with a quick move between them.
Real ES futures data (Yahoo Finance ES=F, 5-minute bars, regular session 9:30 AM–4:00 PM ET). Volume at price is approximated by spreading each 5-minute bar's volume across the prices it traded through.
3.2 The four types
Day type
Typical description
What it often looks like
Normal
Wide first-hour range; most trade stays inside it
Bell profile; value area near the middle
Normal variation
First-hour range is pushed outside on one side
Bell with an extension; value area shifts a little
Trend
One-directional move for most of the session
Thin, elongated profile; POC near one end
Double distribution
Two separate areas of trade
Two fat nodes with a thin gap
Why bother naming them? Because naming forces you to look at structure, not just direction. Two days can both close higher, yet one was a quiet rotation inside the first hour and the other was a long one-way push. They call for different questions the next morning, such as whether the market is still in balance or has moved to new value.
A second reason is comparison. When you label forty sessions, you can see what share were normal, what share extended and how the next day tended to open after each type. That is far more useful than a single memorable chart, because it is your own sample, with the boring days included.
A normal day is one in which the early range, set in the first hour, does the heavy lifting. The rest of the session mostly rotates within it. A normal variation day starts similarly but then breaks out of the early range on one side, building a somewhat shifted value area.
A trend day is a strong, mostly one-way session. October 30, 2026 was a trend day down with an intraday range of about 196 points. Profiles of trend days are thin because price does not stay anywhere long enough to pile up letters. A double distribution day shows a first area of trade, a fast move through a thin zone, and a second area of trade. It is a different pattern from a trend day: the second area is where the market settles again.
3.3 Labels come after the fact
You can only be sure what type of day it was when it is over. At 11 AM, a normal day and a normal variation day look the same. The label is useful for review and for studying how often each type follows a certain opening, but it should not be treated as a forecast during the session.
A more practical habit is to keep a short list of possibilities as the day develops. 'So far the day is inside the first hour's range. If it breaks out and builds value, it may become a variation or a double distribution.' That keeps your mind open without pretending to know.
If you want to see the shapes without the structure, compare these pictures with the five profile shapes in Guide 1, Lesson 3. The shapes are the same family. This lesson adds the question of how the day got there.
Key takeaways
Four common day types: normal, normal variation, trend, double distribution.
A trend day is thin and elongated (Oct 30, 2026 was about 196 points in one direction).
A double distribution is not the same as a trend day: it has two areas of agreement.
Labels come after the fact; during the day, keep a list of possibilities.
LESSON 10 · 10 MIN READ
Initial Balance and Range Extension
🎯 You'll learn
How to mark the Initial Balance and its midpoint
What narrow and wide IBs describe, and what they do not promise
How range extension is observed and how to record it without predicting it
4.1 The Initial Balance
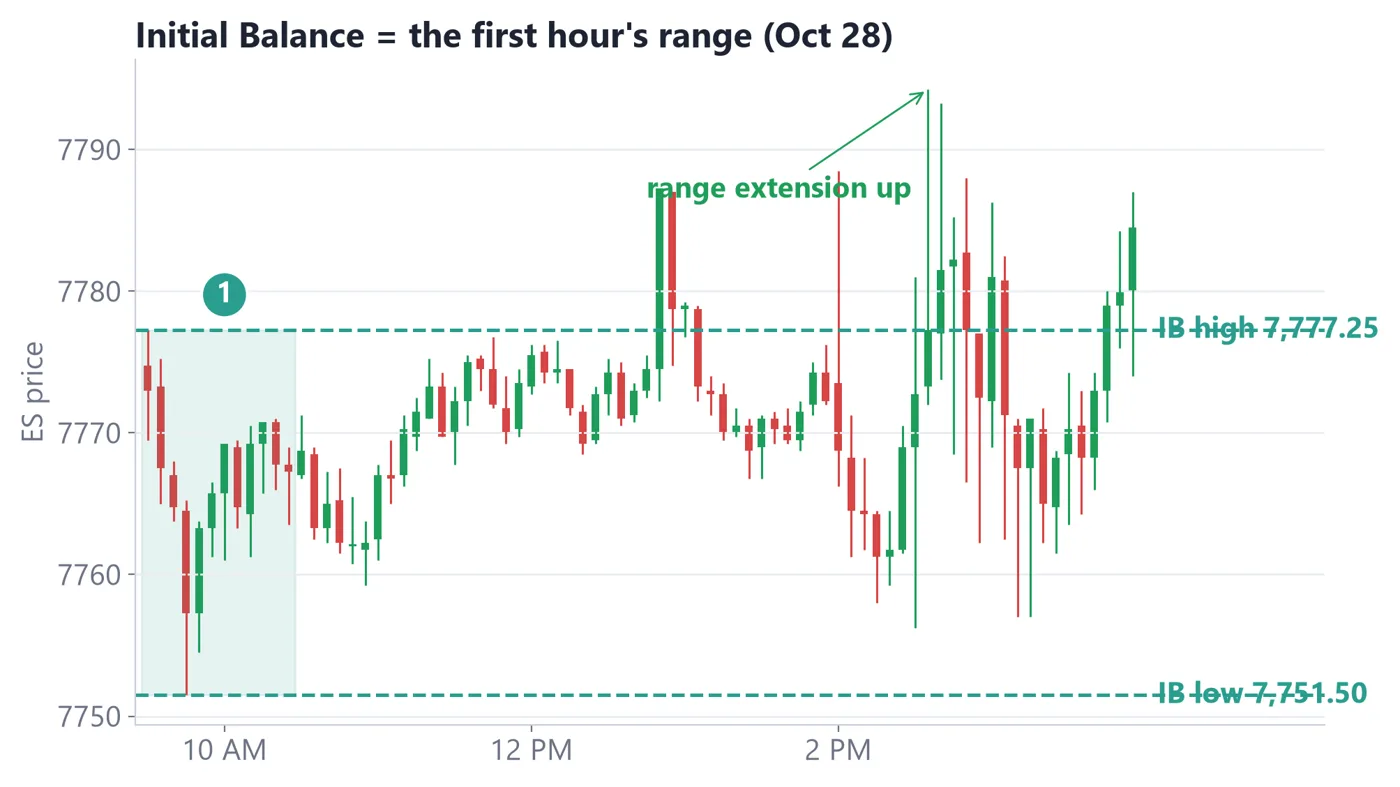
The Initial Balance (IB) is the high and low of the first hour of the regular session: letters A and B on a 30-minute TPO chart, or 9:30 to 10:30 AM ET. The idea is that the first hour contains the most active participation of the day, so its range is a useful frame.
The Initial Balance box on a real day, with range extension marked
How to read it
1The box spans the high and low of the first hour.
2Price that trades outside the box is a <b>range extension</b>.
3Watch whether the extension is brief or builds time and volume outside the box.
Real ES futures data (Yahoo Finance ES=F, 5-minute bars, regular session 9:30 AM–4:00 PM ET). Volume at price is approximated by spreading each 5-minute bar's volume across the prices it traded through.
Why the first hour? In many sessions the opening period carries heavy participation as overnight orders meet fresh interest, so the early range tends to capture how the day began. The IB is not magic; it is simply a consistent, easy-to-mark frame that lets you describe every day the same way. Consistency is the point, because it lets you compare days fairly and build a record.
Mark the IB high, the IB low and the IB midpoint halfway between them. The midpoint is simply a reference line; many traders glance at it to see which half of the first hour's range price is in.
4.2 Narrow versus wide
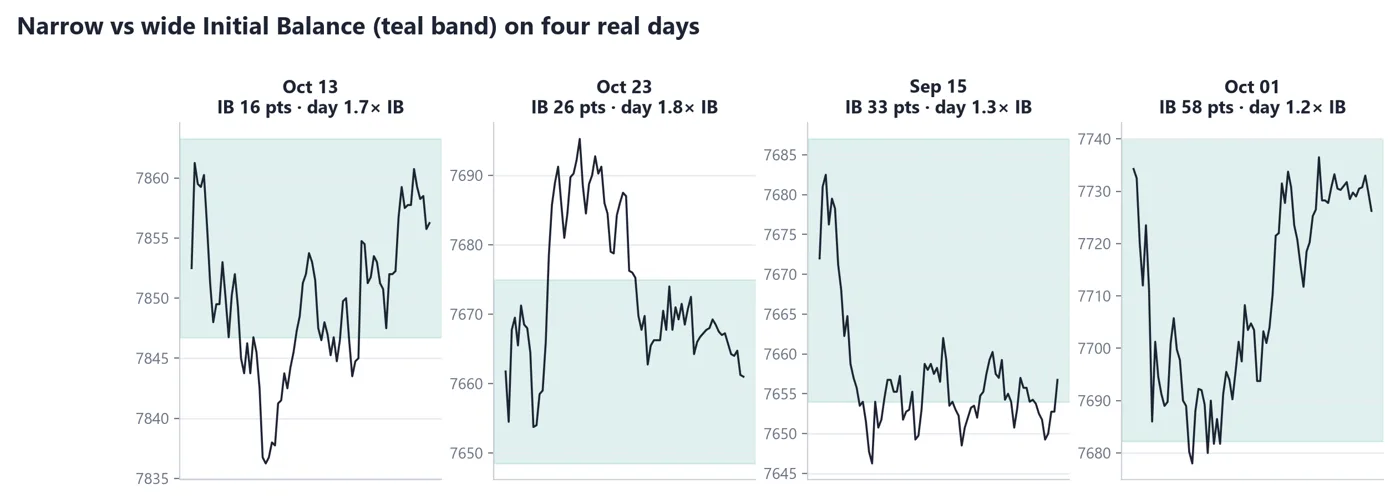
IB width is the distance between the IB high and the IB low. A narrow IB is a small first-hour range compared with recent days. A wide IB is a large one. Width is relative: compare today's IB with your last several sessions rather than with a fixed number.
Four real days: narrow versus wide IB and what followed
How to read it
1Compare the box width with the full day's range afterwards.
2Some narrow-IB days extended a lot; others stayed small.
3Some wide-IB days stayed inside the box; others extended anyway.
Real ES futures data (Yahoo Finance ES=F, 5-minute bars, regular session 9:30 AM–4:00 PM ET). Volume at price is approximated by spreading each 5-minute bar's volume across the prices it traded through.
IB width
Common description
Careful reading
Narrow
Compressed early range; more room for extension
Extension happens on many narrow days but may not happen
Wide
Large early range; much of the day's work may already be done
Extension can still occur, especially after news
The textbook pairing is: narrow IB, more chance of a big extension; wide IB, more chance of staying inside. Treat that as a pattern to test, not a rule. Look at the four examples above and in your own data, and see how often each description held.
4.3 Range extension
Range extension is trading outside the IB. It can happen on one side or, less often, both. Extension up means price traded above the IB high; extension down means it traded below the IB low. What matters is whether the extension is accepted (time and volume build outside) or rejected (price quickly returns inside).
It also helps to separate the size of the extension from its meaning. A small poke of a few ticks beyond the IB high is a very different event from a push of many points that spends hours above it. Ticks are $12.50 each on ES, so even a small poke is worth recording in points and ticks, but it should not be given the same weight as a sustained move. Describe each extension by how far, how long and whether it came back.
An extension that returns inside the IB is sometimes called a failed extension. It is a description, not an instruction. The same applies to extensions that hold: a hold is a description of what happened, not a promise that it continues.
Record the time of the first extension and how long it lasted. Many sessions extend once and then settle. Recording the details teaches you what is typical in the market you study.
Key takeaways
The IB is the first-hour range (letters A and B); mark its high, low and midpoint.
Width is relative: compare today's IB with recent days.
Range extension is trading outside the IB; track whether it is accepted or rejected.
Narrow-IB-means-extension is a pattern to test in your own records, not a rule.
LESSON 11 · 11 MIN READ
Value Area and the 80% Heuristic
🎯 You'll learn
How the value area is built from TPO counts, using one common method
What the '80% rule' claims, its conditions, and why it is unverified
How value area relationships across days describe the market's mood
5.1 The value area in Market Profile
You met the value area in Guide 1: the range that holds about 70% of activity. On a TPO chart it is the range that holds about 70% of the letters. One common method starts at the TPO POC, then adds the pair of rows above or below that has the most letters, repeating until 70% is reached. Platforms differ in the details, so levels can vary by a row or two.
If you already know the volume-based value area from Guide 1, you will notice the TPO version is usually close but not identical. Time and volume are different measures, so the two zones can differ by a few points. Neither is wrong. Many traders mark both and treat the overlap as the more stable zone, and note the difference when they disagree.
The top of that range is the Value Area High (VAH) and the bottom is the Value Area Low (VAL). On Oct 28, 2026, the volume-based levels were a VAL of 7,762.00 and a VAH of 7,777.25 around a POC of 7,770.75. Treat them as reference levels, not as walls.
5.2 The 80% rule, done honestly
You will often read: 'if price opens outside the prior value area and then moves back inside, it has an 80% chance of crossing the whole value area.' This is the 80% heuristic. As stated online it is incomplete and the number is unverified.
The original condition is more specific. Price should open outside the prior value area, re-enter it, and then stay inside for two consecutive 30-minute periods (two TPO letters). The idea is that time spent inside suggests acceptance, which makes a rotation across the range more plausible. Without that acceptance, re-entry alone is just a touch.
The 80% heuristic: all conditions together
1Price opened outside the prior value area
2Price re-entered the prior value area
3Price held inside for two consecutive 30-minute periods
4Only then does the heuristic describe a possible rotation toward the other side
The 80% figure itself comes from trading folklore. It has not been verified for ES and your own records may show a different number. Use it as a hypothesis to test, not as a probability to rely on.
Oct 29, 2026: re-entry without acceptance
How to read it
1The prior VAL was 7,762.00 and price opened below it at 7,747.25.
2Price traded above 7,762 only from 11:30 to 11:40 (high 7,767.25).
3Two 30-minute periods inside were never met, so the heuristic's conditions were never satisfied. The day later reached 7,725.25.
Real ES futures data (Yahoo Finance ES=F, 5-minute bars, regular session 9:30 AM–4:00 PM ET). Volume at price is approximated by spreading each 5-minute bar's volume across the prices it traded through.
5.3 Value area relationships across days
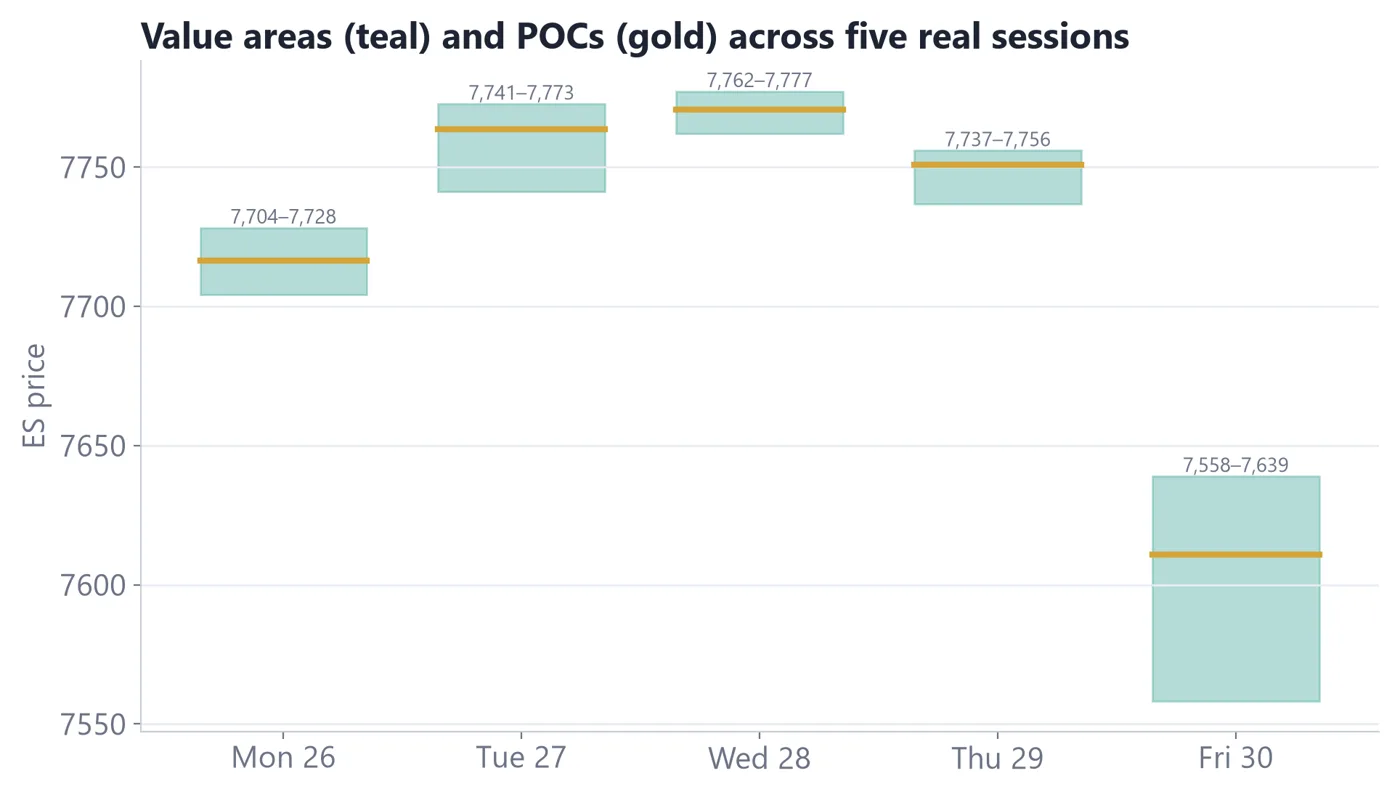
Comparing today's value area with yesterday's gives a simple description of the market's direction. Higher value means today's value sits above yesterday's. Lower value means below. Overlapping value means the two share a large area, which is consistent with balance.
Five consecutive value areas as boxes
How to read it
1Overlapping boxes: a market in balance.
2Boxes stepping higher: a market where acceptance keeps moving up.
Real ES futures data (Yahoo Finance ES=F, 5-minute bars, regular session 9:30 AM–4:00 PM ET). Volume at price is approximated by spreading each 5-minute bar's volume across the prices it traded through.
Relationship
Description
Common reading
Higher, little overlap
Acceptance at higher prices
Buyers in control for now
Lower, little overlap
Acceptance at lower prices
Sellers in control for now
Overlapping
Value shared with the prior day
Balance; market still searching
A practical way to use these relationships is as a morning question, not an answer. If the last three sessions stepped higher with little overlap, ask whether today opens inside that new area or back below it, and what you will consider acceptance. If the last three overlapped, the better question is whether the range is about to be tested. The same framework applies in each case: describe, then watch.
These are descriptions of what happened, and the market can change its mind at any time. A run of higher values can end in one session. Use the relationship to frame your questions, then watch what the next session does.
Key takeaways
One common method builds the value area from the TPO POC outward to about 70% of the letters.
The 80% heuristic needs an open outside value, a re-entry, and two 30-minute periods inside.
The 80% number is unverified; test it on your own records.
Higher, lower and overlapping value describe the market's mood; they do not forecast.
LESSON 12 · 12 MIN READ
Studying Breakouts and Failed Breakouts
🎯 You'll learn
How to tell acceptance from rejection after a break of a range or level
How to study a breakout with risk maths on ES in ticks, points and dollars
How a failed breakout and a skipped setup look in a hypothetical study
6.1 What a breakout is, and what it is not
A breakout is a move beyond a reference level, such as the IB high, a prior day's high or the edge of a multi-day balance range. A breakout is only an event. What matters is what happens afterwards: price either finds acceptance outside the level or goes back in.
Everything in this lesson is an illustrative study framework. It is not a recommendation to trade. Futures involve substantial risk of loss, including from gaps and slippage.
A multi-day balance range, then a break
How to read it
1The shaded range is where price rotated for several sessions.
2The break is the first move outside it.
3Look for time and activity outside the range (acceptance) or a quick return inside (rejection).
Real ES futures data (Yahoo Finance ES=F, 5-minute bars, regular session 9:30 AM–4:00 PM ET). Volume at price is approximated by spreading each 5-minute bar's volume across the prices it traded through.
6.2 Acceptance and rejection checklist
Study checklist for a breakout
1Where is the level? (IB high, prior high, balance edge)
2Is today's context balanced or imbalanced?
3How long did price stay outside? (one letter, two, more)
4Did it come back inside, and did it stay inside?
5What is the risk in ticks and dollars, and the distance to the next reference?
6Does the plan pass your own reward-to-risk rule? If not, skip.
Time outside is the key idea. A break that spends two or more 30-minute periods outside, with new trade building there, is consistent with acceptance. A break that returns inside within one period is consistent with rejection. The first tells you value may be moving. The second tells you the market found no takers at the new price.
You may also see a rule of thumb about the 'next day follow-through'. As with the 80% heuristic, treat it as a hypothesis for your own sample, not a fact.
6.3 Risk maths on ES
On ES, 1 point = $50 and 1 tick = $12.50. Risk per contract is stop distance times $50 per point. A stop must sit where the idea is clearly wrong; a stop only a few ticks away often sits inside normal 5-minute noise. Size comes from your dollar risk, not from the order you want to place.
Stop distance
Ticks
Risk per contract
4 points
16
$200
6 points
24
$300
10 points
40
$500
6.4 Hypothetical example 1: a breakout that fails
Hypothetical example. Use the Oct 29, 2026 levels. Prior VAL was 7,762.00 and price opened at 7,747.25, below it. Suppose a student studies a 'break back above value' idea: entry at 7,762.00, a stop 4 points below (7,758.00; 16 ticks; $200 per contract) and a target at the prior POC of 7,770.75 (8.75 points; 35 ticks; $437.50).
Result: price traded above 7,762 only from 11:30 to 11:40, with a high of 7,767.25. It spent only about ten minutes above the level and never held two 30-minute periods inside value. The target was not reached. The low of 7,725.25 came at 1:50 PM and the close was 7,754.25. The hypothetical stop at 7,758.00 would have been hit for about $200 per contract, before slippage.
What the student learns: the checklist question 'did it stay inside?' answered 'no'. A plan that required two periods of acceptance before acting would have produced no trade.
Oct 29, 2026: the failed attempt back into value
How to read it
1Price opens below the prior VAL.
2The poke above 7,762 lasts about ten minutes, high 7,767.25.
3The later low of 7,725.25 shows the rejection played out.
Real ES futures data (Yahoo Finance ES=F, 5-minute bars, regular session 9:30 AM–4:00 PM ET). Volume at price is approximated by spreading each 5-minute bar's volume across the prices it traded through.
6.5 Hypothetical example 2: a setup that is skipped
Hypothetical example. Another student reuses the entry at 7,762.00 but puts the stop below the open at 7,747.25. That is 14.75 points, 59 ticks, or $737.50 per contract. The target is still 8.75 points away, so reward-to-risk is about 0.6 to 1. The student's rule requires at least 1.5 to 1, so the setup is skipped and the reason is written in the journal.
On Oct 30, 2026 a trend day moved about 196 points in one direction. A student who had treated every move back toward a reference as an automatic fade would have been fighting the whole day. Whether an idea is a breakout study or a fade study, the context question comes first: balance, or imbalance?
Key takeaways
A breakout is an event; acceptance or rejection afterwards is what gets studied.
Time outside the level (two or more 30-minute periods) is the main acceptance clue.
Risk maths on ES: 1 point = $50; 1 tick = $12.50; skip setups that fail your reward-to-risk rule.
One example proves little; judge a framework on many recorded cases, including failures and skips.
Quick check answers
Lesson 1: Q1 B, Q2 C, Q3 A
Lesson 2: Q1 C, Q2 B, Q3 A
Lesson 3: Q1 B, Q2 B, Q3 A
Lesson 4: Q1 A, Q2 A, Q3 B
Lesson 5: Q1 A, Q2 A, Q3 A
Lesson 6: Q1 B, Q2 B, Q3 B
Lesson 7: Q1 A, Q2 A, Q3 A
Lesson 8: Q1 A, Q2 A, Q3 A
Lesson 9: Q1 A, Q2 A, Q3 A
Lesson 10: Q1 A, Q2 A, Q3 A
Lesson 11: Q1 A, Q2 A, Q3 A
Lesson 12: Q1 A, Q2 B, Q3 A
Glossary
80% heuristic
An unverified rule of thumb about crossing the prior value area, requiring open outside, re-entry and two 30-minute periods inside.
Acceptance
Price spending time at a level (for example two 30-minute periods), not just touching it.
Acceptance / rejection
Price building time outside a level versus returning quickly.
Auction Market Theory
The view that markets search for prices where trade flows in both directions.
Balance / imbalance
Price rotating in a range (balance) versus moving to find new value (imbalance).
Bell profile
A balanced profile with a fat middle and thin tails.
Breakout
A move beyond a reference level; only an event until acceptance or rejection is seen.
Composite profile
One profile built from several sessions.
Confluence
Two or more reference points in the same price area.
Developing POC
The POC as it updates live during the session.
Double distribution
A profile with two fat areas separated by a thin zone.
ES
The E-mini S&P 500 futures contract. One point = $50; one tick (0.25) = $12.50.
HVN / LVN
High- / low-volume node: fat and thin parts of the profile.
Hypothetical example
An invented study case, not a real trade and not a recommendation.
IB midpoint
The halfway price between the IB high and IB low.
Initial Balance (IB)
The high and low of the first hour of the regular session.
Long liquidation
Selling by traders closing out long positions.
Market Profile
A chart that stacks lettered 30-minute periods at each price to show time spent.
Micro E-mini
A smaller contract, one tenth the size of the standard E-mini.
Normal / normal variation day
Days that mostly stay inside the first-hour range, or push outside it on one side.
Open types
Descriptions of the first minutes: open-drive, test-drive, rejection-reverse, open-auction.
P-shape / b-shape
Profiles with the fat part near the top (P) or bottom (b) of the range; context, not a forecast.
POC
Point of Control: the price with the most volume in the window.
Range extension
Trading outside the Initial Balance.
Responsive / initiative
Activity back toward value versus activity away from value into new prices.
Reward-to-risk
Distance to the target divided by distance to the stop.
RTH
Regular trading hours, 9:30 AM–4:00 PM ET. The profiles in this guide use RTH only.
Short covering
Buying by traders closing out short positions.
Single print
A price row with only one letter; a fast move through that level.
Support / resistance
Price areas where buyers or sellers have reacted before.
Tick
The smallest price step: 0.25 points on ES.
TPO
Time Price Opportunity: one letter placed at a price for one 30-minute period.
TPO POC
The price row with the most letters.
Trend day
A mostly one-way session, with a thin elongated profile.
VAH / VAL
Value Area High / Low: the top and bottom of the value area.
Value Area (VA)
The range holding about 70% of the window's volume.
Visible-range profile
A profile built from the bars currently on screen.
WHITE FEATHER FINANCE
What's next
Supplement 2: Order Flow, Footprint Charts & Delta, which shows who was aggressive inside each bar.
The main bookLearn to Trade in 31 Days: futures + options, one lesson a day. wfeatherfinance.com/learn-to-trade-31-days
The free library8 free downloads + 4 Field Guides at wfeatherfinance.com/free-library
Daily market shortsYouTube, TikTok and X: @WFeatherFinance