FREE SUPPLEMENT 4 OF 5 · TO LEARN TO TRADE IN 31 DAYS
Derivatives Part II: Options, Greeks & Spreads
Understand calls, puts, the Greeks and defined risk before you ever place a trade
8 lessons~78 minBeginner to intermediate8 printable worksheets
Educational only. Not financial advice. Futures trading involves substantial risk of loss and is not suitable for every investor. Past market behaviour shown here does not predict future results.
WHITE FEATHER FINANCE
Important: please read
Educational only. Not financial advice. This book teaches how traders read market data and manage risk. It does not tell you what to buy or sell.
Trading involves substantial risk of loss. Futures are leveraged and can lose more than your deposit. Options can expire worthless, and selling options can lose far more than the premium received. Only trade money you can afford to lose.
Past market behaviour does not predict future results. Charts and examples are historical or hypothetical, for illustration only. Rules of thumb quoted from trading literature are heuristics, not guarantees.
White Feather Finance is an education company, not a registered investment adviser, broker-dealer or commodity trading advisor.
How to use this book
This supplement is for traders who already read basic charts on ES or NQ futures, or on stocks, and now want to understand options on SPY and QQQ. It is educational only. It does not recommend any trade, any strategy or any product, and it does not suggest that options can be used to earn a steady return.
You will learn what a call and a put really are, how to read an option chain, how payoffs and breakevens work at expiry, and what delta, theta and vega mean in plain English. You will see why option prices can fall even when you guess the direction right (time decay and IV crush), how defined-risk spreads cap the loss, and why short options with undefined risk need far more care. You will also learn to size an options trade to a fixed account risk, to check liquidity before you click, and to use futures-style context such as VWAP and value areas as a frame for strikes and timing. A short section covers options on futures, such as ES options, and their different contract multipliers.
Every number in a worked example is a hypothetical round figure, labelled as such, with the arithmetic shown. Options carry a real risk of losing the entire amount paid, and some strategies can lose more than the account holds.
Before you start: Basic chart reading (candles, support and resistance, volume). Supplement 1 (Market Profile) helps for Lesson 8 but is not required; value areas and VWAP are explained again where used.
📖 ReadPlain-English explanations; every term is in the glossary.
📊 SeeEvery concept has a chart or a labelled diagram.
🛠️ DoA 5-minute "Try it" task and a 3-question quick check, plus a printable worksheet for each lesson.
🎬 WatchShort companion videos on YouTube @WFeatherFinance.
What a call, a put, a strike, an expiry and a premium are
Why one SPY or QQQ option controls 100 shares (the multiplier)
How to read the rows of an option chain, and how options on futures differ
1.1 A contract with a deadline
A futures trader already understands one kind of contract: an obligation to buy or sell something at a set price later. An option is different in one key way. It gives the buyer a right, not an obligation. The buyer pays a price for that right, and the right expires on a set date.
A call option gives the buyer the right to buy the underlying at a fixed price. A put option gives the buyer the right to sell the underlying at a fixed price. The fixed price is the strike. The last day the right exists is the expiry (or expiration date). The price the buyer pays up front is the premium. The underlying here is a fund such as SPY (tracks the S&P 500) or QQQ (tracks the Nasdaq-100).
The seller (also called the writer) takes the other side. The seller collects the premium and accepts the obligation if the buyer uses the right. That is why the two sides are not mirror images in risk. A buyer can lose at most the premium paid. A seller of some options can lose far more than the premium collected. Lesson 6 returns to this.
1.2 The multiplier: 100 shares per contract
Option prices are quoted per share, but one standard SPY or QQQ contract covers 100 shares. That number is the multiplier. To find the cash cost, multiply the quoted premium by 100.
Hypothetical example. SPY trades at 600 (a round placeholder, not a real quote). A call with a 600 strike is quoted at 4.50. The cost is 4.50 x 100 = $450 for one contract. If the quote were 0.45, the cost would be 0.45 x 100 = $45. Quotes that look small can still be real money once the multiplier is applied.
Term
Plain meaning
Hypothetical value
Underlying
The thing the option is based on
SPY at 600
Strike
The fixed price in the contract
600
Expiry
Last day the right exists
30 days from now
Premium
Price per share, paid by the buyer
4.50
Multiplier
Shares per contract
100
Cost of 1 contract
Premium x multiplier
4.50 x 100 = $450
1.3 Reading an option chain
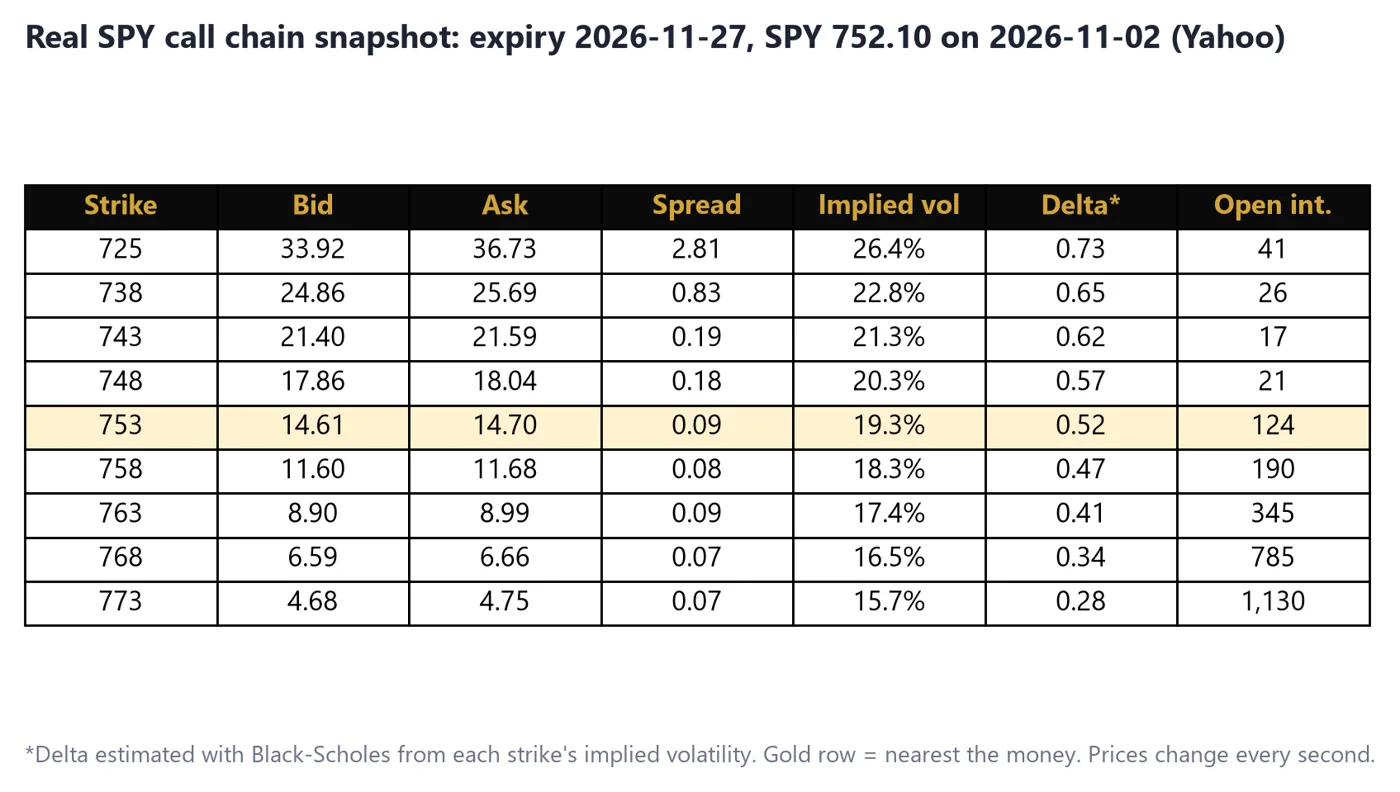
An option chain is the menu of every strike and expiry for one underlying. Calls usually sit on one side and puts on the other. Each row is a strike. Each strike shows a bid (the best price a buyer is offering), an ask (the best price a seller wants), the volume traded today, the open interest (contracts still open), the implied volatility (IV, covered in Lesson 5) and often the delta (Lesson 3).
A real SPY option-chain snapshot from public data
How to read it
1Each row is one strike. Find the row nearest the current SPY price: that is 'at the money'.
2Bid is what you could sell for now. Ask is what you would pay to buy now. The gap between them is a cost.
3Calls with strikes below the price, and puts with strikes above it, are 'in the money' and already hold intrinsic value.
4Delta and IV columns are estimates from a model, not guarantees.
Real ES futures data (Yahoo Finance ES=F, 5-minute bars, regular session 9:30 AM–4:00 PM ET). Volume at price is approximated by spreading each 5-minute bar's volume across the prices it traded through.
Two words come up constantly. In the money (ITM) means the option would have value if it expired right now: a call with the strike below the price, or a put with the strike above it. Out of the money (OTM) is the opposite. At the money (ATM) means the strike is close to the current price. An option's premium has two parts: intrinsic value (how far it is in the money, if at all) and time value (what the market charges for the chance of more movement before expiry).
1.4 Options on futures, briefly
Options also exist on futures, such as options on E-mini S&P 500 (ES) futures. The structure is the same, but the underlying is a futures contract and the multiplier is different. ES futures are worth $50 per index point, so an ES option's premium is also multiplied by $50. Hypothetical example: an ES option quoted at 40 points costs 40 x $50 = $2,000. A SPY option quoted at 4.50 costs $450. Always check the multiplier of the exact product on your broker's contract specifications page before you compare costs. Exercising an option on a future results in a futures position, not shares.
1.5 American and European style
SPY and QQQ options are American style: the holder may exercise on any trading day up to expiry. Some index options are European style: exercise only at expiry. This matters mainly for people who sell options, because an American-style option they sold can be exercised against them early (Lesson 6).
Key takeaways
A call is the right to buy and a put is the right to sell at a fixed strike before expiry.
Premium is quoted per share; multiply by 100 for SPY or QQQ contracts.
An option's price is intrinsic value plus time value.
Options on futures use the futures multiplier (for ES, $50 per point); always check the contract specifications.
LESSON 1 · PRACTICE WORKSHEET
Lesson 1 practice: read the chain
You need a pencil and, for the last task, your broker's option chain.
1Find the row nearest the current SPY price. Write its strike, the call ask, and the dollar cost of one contract.
Show answer
Answers vary by snapshot: check that cost = call ask x 100.
2On the chart, circle one call that is in the money and one that is out of the money. Explain how you know.
Show answer
Check that the ITM call has a strike below the current price and the OTM call has a strike above it.
3A put is quoted 3.10 bid and 3.25 ask on QQQ. What would you pay to buy one contract at the ask, and what would you receive selling at the bid?
Show answer
Buy: 3.25 x 100 = $325. Sell: 3.10 x 100 = $310.
4On your OWN option chain, pick SPY or QQQ, an expiry about 30 days away and the at-the-money call. Write the bid, ask, open interest and the dollar cost of one contract at the ask.
Show answer
Answers vary: check that cost = ask x 100 and that open interest is written down.
5A hypothetical ES option is quoted at 25 points. What is its cost?
Show answer
25 x $50 = $1,250.
LESSON 2 · 9 MIN READ
Payoffs at expiry and breakeven
🎯 You'll learn
How to draw the profit and loss of a long call and a long put at expiry
How to calculate breakeven and maximum loss
Why 'right direction' is not the same as 'profit'
2.1 The long call at expiry
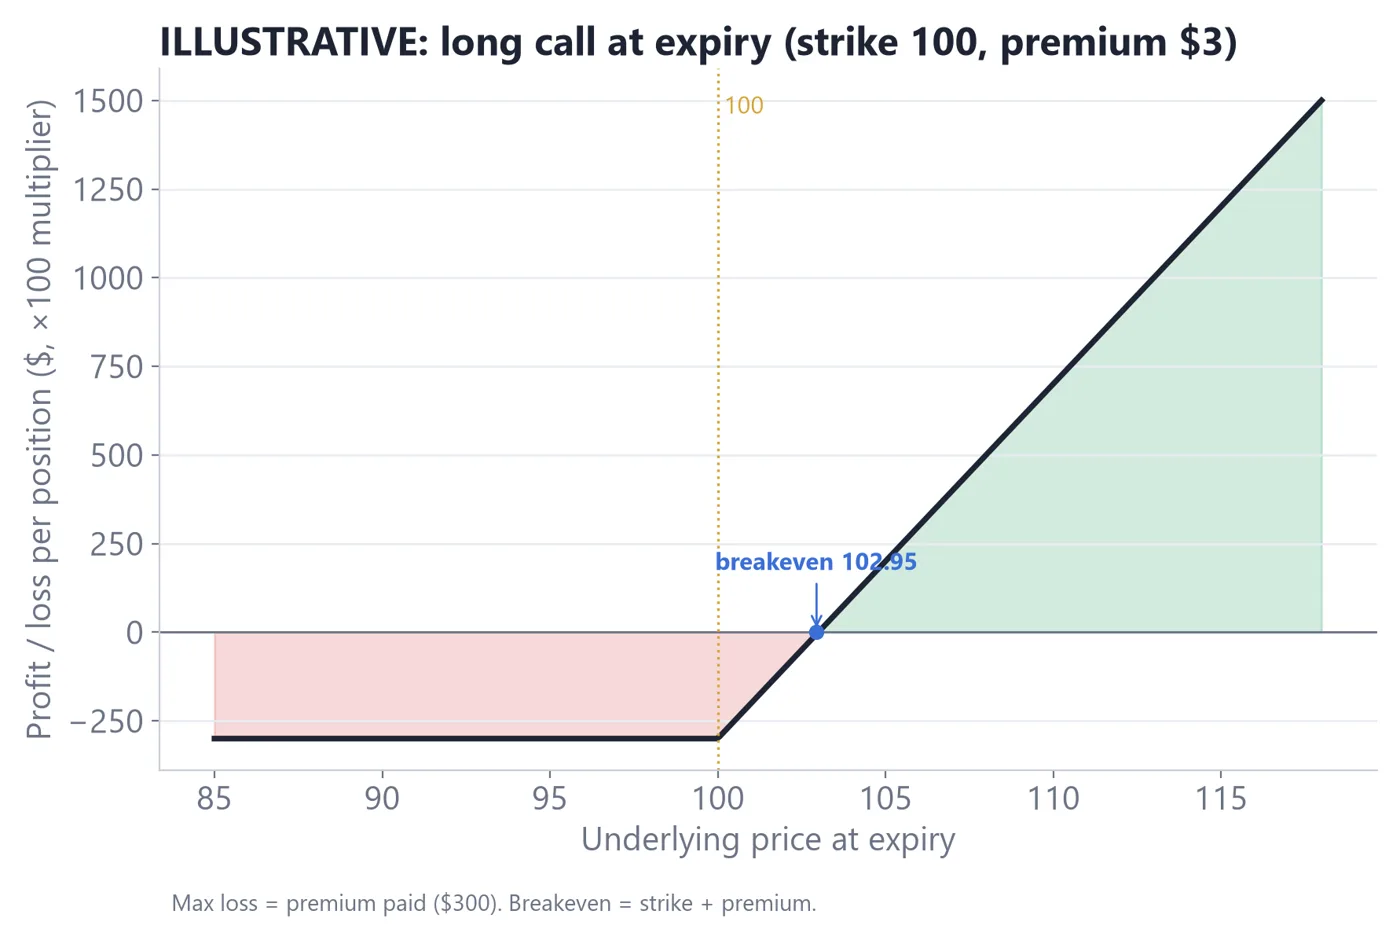
A payoff diagram shows profit or loss on the vertical axis and the underlying price at expiry on the horizontal axis. It ignores time before expiry, which makes it the simplest picture of an option. We start with a long call: a call you bought.
Hypothetical example. SPY is 600. You buy one 600-strike call for 4.50, paying 4.50 x 100 = $450. At expiry the call is worth the larger of zero and (SPY price minus 600). Your profit per share is that value minus the 4.50 you paid.
Long call payoff at expiry (illustrative)
How to read it
1Below the strike the option expires worthless: the loss is flat at the premium paid.
2The breakeven is the strike plus the premium: 600 + 4.50 = 604.50.
3Above the breakeven, profit rises 1 point per share for each 1-point rise in SPY.
4The maximum loss is known in advance: $450 here.
Illustrative diagram for teaching. Not real market data.
SPY at expiry
Call value
Profit per share
Profit per contract
590
0
-4.50
-$450
600
0
-4.50
-$450
604.50
4.50
0
$0 (breakeven)
610
10.00
+5.50
+$550
Look at the 600 row. SPY finished exactly where it started, which is not a loss on a stock position, yet the call buyer lost the full $450. Direction alone is not enough. The move must be large enough to cover the premium and must happen before expiry.
2.2 The long put at expiry
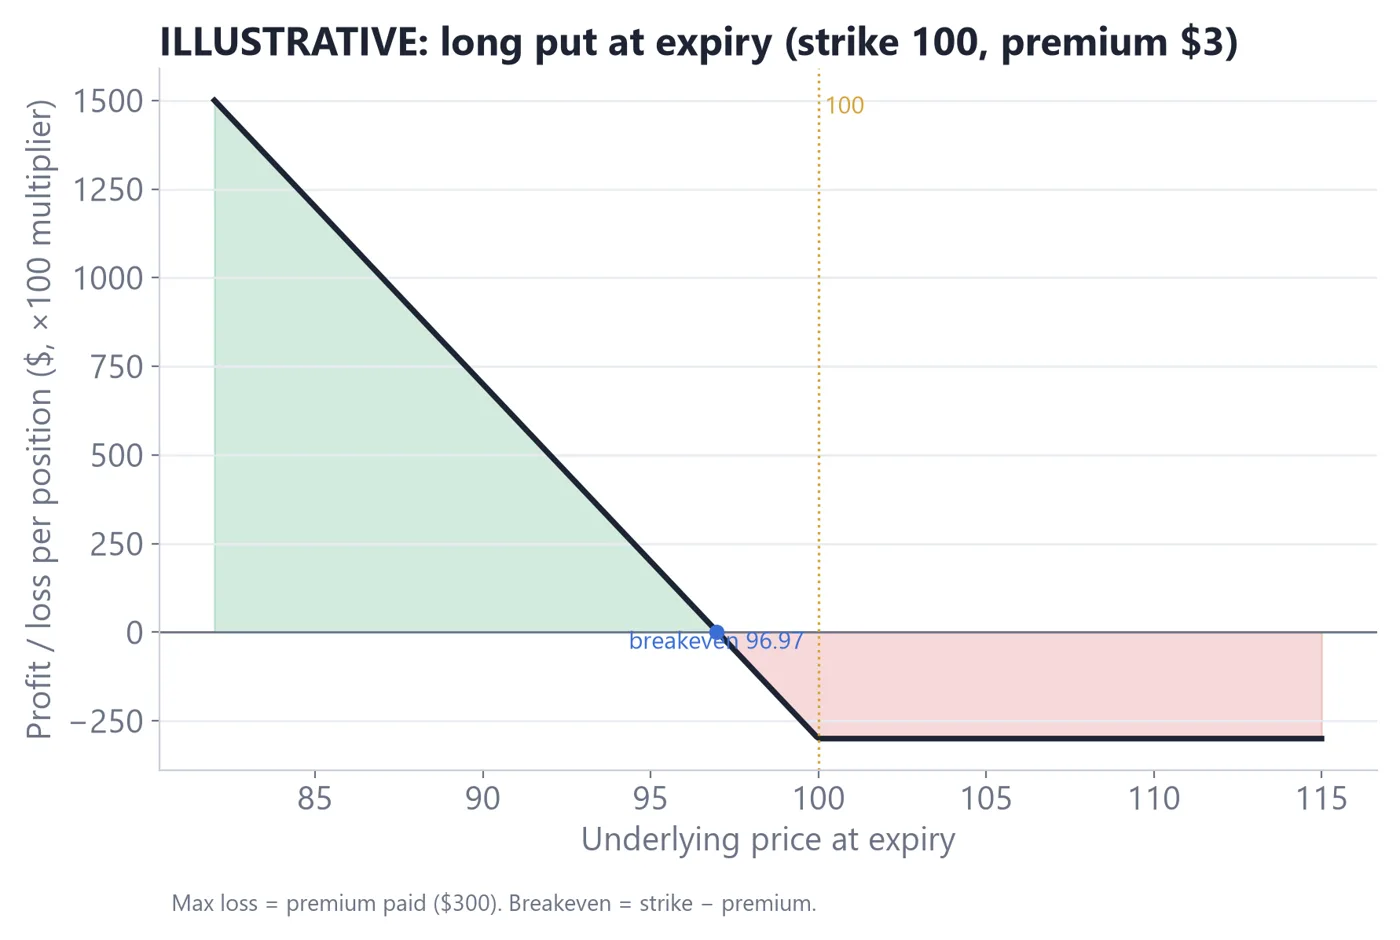
A long put gains when the underlying falls below the strike. Hypothetical example. SPY is 600. You buy one 600-strike put for 5.00, paying 5.00 x 100 = $500. At expiry the put is worth the larger of zero and (600 minus SPY price).
Long put payoff at expiry (illustrative)
How to read it
1Above the strike the put expires worthless: the loss is flat at the premium paid, $500.
2The breakeven is the strike minus the premium: 600 - 5.00 = 595.
3Below 595, profit grows 1 point per share for each 1-point drop in SPY.
4The most a put can be worth is the strike (if SPY went to zero), which is a theoretical limit only.
Illustrative diagram for teaching. Not real market data.
Check one point. If SPY falls to 585 at expiry, the put is worth 600 - 585 = 15.00. Profit per share is 15.00 - 5.00 = 10.00, so profit per contract is 10.00 x 100 = $1,000. If SPY ends at 598, the put is worth 2.00, the profit per share is 2.00 - 5.00 = -3.00, and the loss is $300: SPY fell, yet the buyer lost money.
2.3 Payoff versus reality before expiry
The diagrams describe the very end. Most traders do not hold to expiry. Before expiry the option still has time value, so its price follows a smooth curve above the hockey-stick shape. That curve is why Lessons 3 to 5 exist. For now, use the payoff diagram for two simple jobs: finding the breakeven and the maximum loss before you buy.
A skipped trade is often the right result of this exercise. Hypothetical example that is skipped. A trader hopes SPY will rise 1% in a week. SPY is 600, so 1% is 6 points. The 600 call costs 4.50, so the breakeven is 604.50, a 0.75% rise. The trader checks the next expiry before the hoped-for date and sees the option expires in four days. A move of 1% might arrive after expiry. The trader concludes the setup does not fit the time available and skips it. Noting why you skipped is as useful as logging a trade.
One more habit helps. Before buying, write the three numbers side by side: the cost in dollars (premium x 100), the breakeven price and the date the right expires. If you can state all three from memory in ten seconds, you understand the position well enough to size it. If you cannot, wait.
Key takeaways
A long call or long put loses at most the premium paid, and it loses all of it if the option expires worthless.
Call breakeven is strike plus premium; put breakeven is strike minus premium.
The underlying can move your way and the position can still lose money.
Payoff diagrams show expiry outcomes only; they are not forecasts.
LESSON 2 · PRACTICE WORKSHEET
Lesson 2 practice: breakeven and payoff
You need a pencil and a calculator. The last task uses your own option chain.
1A call has strike 600 and premium 4.50. Mark the breakeven on the diagram and write the profit per contract if SPY ends at 612.
Show answer
Breakeven 604.50. At 612 the call is worth 12.00; profit per share 7.50; per contract $750.
2A put has strike 600 and premium 5.00. Write the breakeven and the loss per contract if SPY ends at 603.
Show answer
Breakeven 595. At 603 the put expires worthless: loss $500.
3A hypothetical 500-strike QQQ call costs 3.20. What is the breakeven, and what is the maximum loss per contract?
Show answer
Breakeven 503.20. Maximum loss 3.20 x 100 = $320.
4On your OWN chain, choose one at-the-money SPY or QQQ call about 30 days out. Write the strike, the ask, the breakeven and the percentage move needed to reach it.
Show answer
Answers vary: check that breakeven = strike + ask and the percentage = (breakeven - price) / price.
LESSON 3 · 10 MIN READ
Delta and the other Greeks in plain English
🎯 You'll learn
What delta, gamma, theta and vega measure
How to turn delta into dollars per contract
Why Greeks are estimates that change as the market moves
3.1 What the Greeks are
The Greeks are measurements of how an option's price is expected to change when one input changes. They come from a pricing model, so they are estimates, and they shift as the market moves. You do not need the maths. You need the meaning.
Greek
Measures sensitivity to
Plain meaning
Delta
A 1-point move in the underlying
How much the option price changes for a 1-point move
Gamma
Change in delta
How fast delta itself changes
Theta
One day passing
How much time value leaks away per day
Vega
A 1-point change in implied volatility
How much the price changes if IV rises or falls
3.2 Delta: the one that matters first
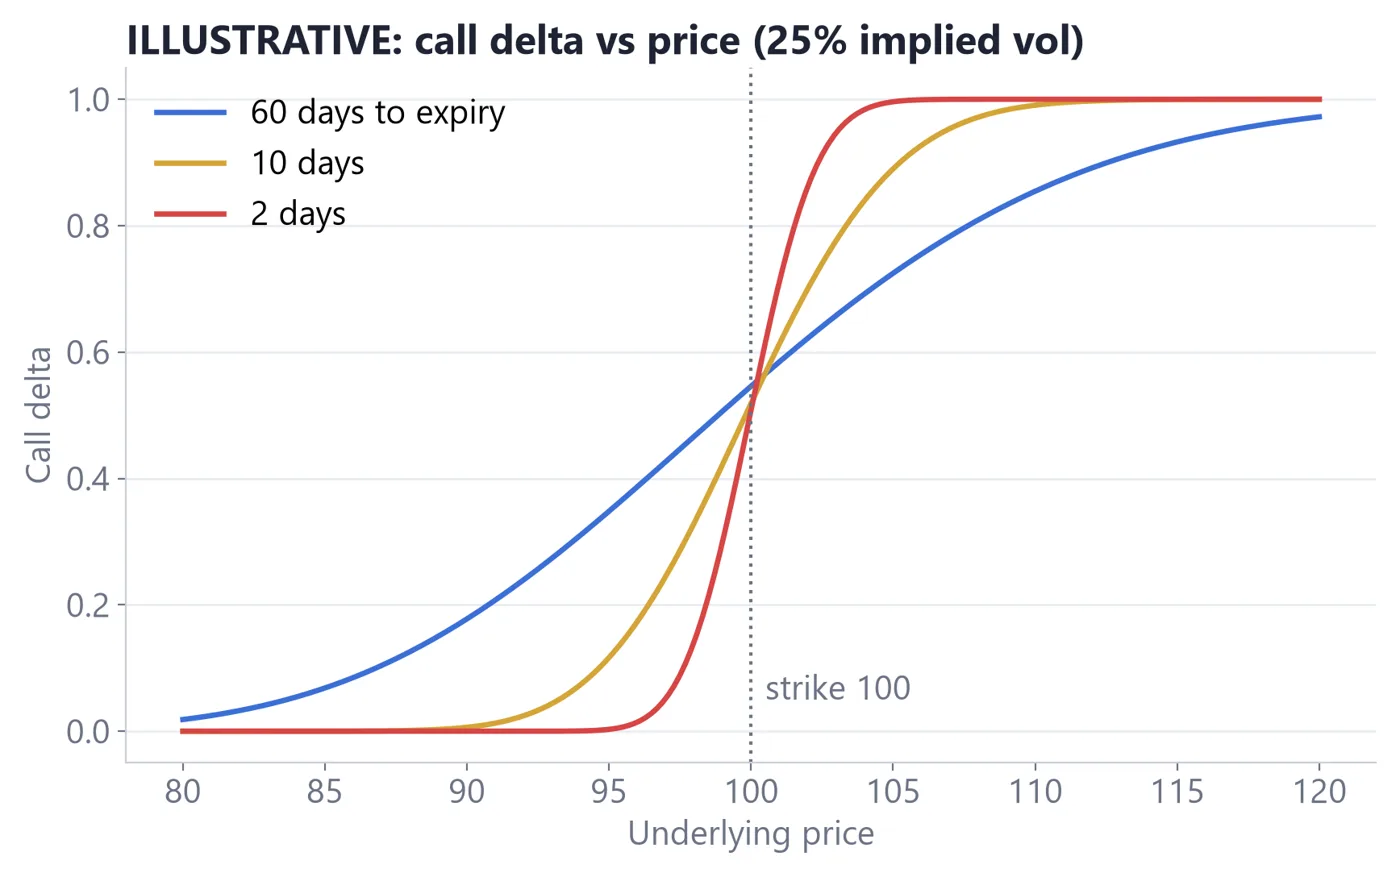
Delta is the expected change in the option price for a 1-point move in the underlying. A call has a delta between 0 and 1. A put has a delta between 0 and -1 (it gains when the price falls). Per contract, multiply delta by the 100 multiplier.
Hypothetical example. A SPY call has a delta of 0.50. If SPY rises 1 point and nothing else changes, the call is expected to gain about 0.50 per share, or 0.50 x 100 = $50 per contract. With 5 contracts at delta 0.30, your position behaves like 5 x 100 x 0.30 = 150 shares of SPY for small moves. That 'share-equivalent' number is useful for comparing an options position with a futures position.
Call delta versus underlying price (illustrative)
How to read it
1Deep out of the money, delta is near 0: the option barely reacts.
2At the money, delta is near 0.50.
3Deep in the money, delta approaches 1.00: the option moves almost like the shares.
4The curve is steepest near the strike. That steepness is gamma.
Illustrative diagram for teaching. Not real market data.
A futures trader can compare: one ES future has a delta of 1.0 to its own price. A 0.50-delta ES option behaves roughly like half an ES contract for small moves. That equals about 0.5 x $50 = $25 per index point. This is only an approximation.
3.3 Gamma, theta, vega
Gamma tells you how much delta changes when the underlying moves 1 point. It is largest for at-the-money options near expiry. High gamma means the position's behaviour changes quickly, which can help or hurt.
Theta is the daily cost of holding time value. Hypothetical example. A long option has a theta of -0.05. Each day, with everything else unchanged, it is expected to lose about 0.05 per share, or 0.05 x 100 = $5 per contract per day. Theta is negative for the buyer and works in the opposite direction for the seller. Lesson 4 explains why theta grows near expiry.
Vega measures sensitivity to implied volatility. Hypothetical example. An option has a vega of 0.10. If IV rises by 1 percentage point, the price is expected to rise 0.10 per share, or $10 per contract. If IV falls 5 points, the loss from vega alone is 5 x $10 = $50 per contract. Lesson 5 shows how this can erase a gain.
A loose rule of thumb, sometimes quoted by traders, says an option's delta is a rough guide to the market-implied chance of finishing in the money. Treat that as a heuristic only. It is model-based, not a prediction, and it says nothing about what will actually happen.
Putting the four together: a trader looking at a chain should read delta for direction exposure, gamma for how unstable that exposure is, theta for the daily cost of waiting, and vega for how much a change in nervousness matters. Two options with the same delta can behave very differently if one expires tomorrow and the other in three months.
Key takeaways
Delta is the expected option price change for a 1-point move; multiply by 100 for dollars per contract.
Delta times 100 times contracts gives share-equivalent exposure.
Theta is the daily time cost and vega is sensitivity to implied volatility.
All Greeks are model estimates and they change constantly.
LESSON 3 · PRACTICE WORKSHEET
Lesson 3 practice: Greeks in dollars
You need a calculator. The last task uses your own option chain.
1Mark on the curve roughly where delta is 0.50, near 0, and near 1.00. Label each as ITM, ATM or OTM.
Show answer
About 0.50 = at the money; near 0 = far out of the money; near 1.00 = deep in the money.
2You hold 4 SPY calls with delta 0.25 each. What is your share-equivalent exposure, and what is the expected gain if SPY rises 3 points?
Show answer
4 x 100 x 0.25 = 100 shares. Gain about 100 x 3 = $300 for small moves.
3An option has theta -0.08. What is the expected one-day time cost for 2 contracts?
Show answer
0.08 x 100 x 2 = $16 per day.
4An option has vega 0.12 and IV falls 4 points. What is the vega loss for one contract?
Show answer
0.12 x 4 = 0.48 per share; x 100 = $48.
5On your OWN chain, find the delta, theta and vega of one at-the-money SPY or QQQ option about 30 days out. Convert each to dollars per contract.
Show answer
Answers vary: check that each Greek was multiplied by 100.
LESSON 4 · 9 MIN READ
Time decay
🎯 You'll learn
Why an option loses time value as expiry approaches
Why decay speeds up in the final weeks
How decay differs for buyers and sellers, and what that does and does not imply
4.1 Time value is a melting asset
Lesson 1 split an option's premium into intrinsic value and time value. Time value is the price of the chance that the underlying moves further before expiry. On expiry day, no chance is left, so time value is zero. Every day in between, some of it disappears. This steady loss is time decay, measured by theta.
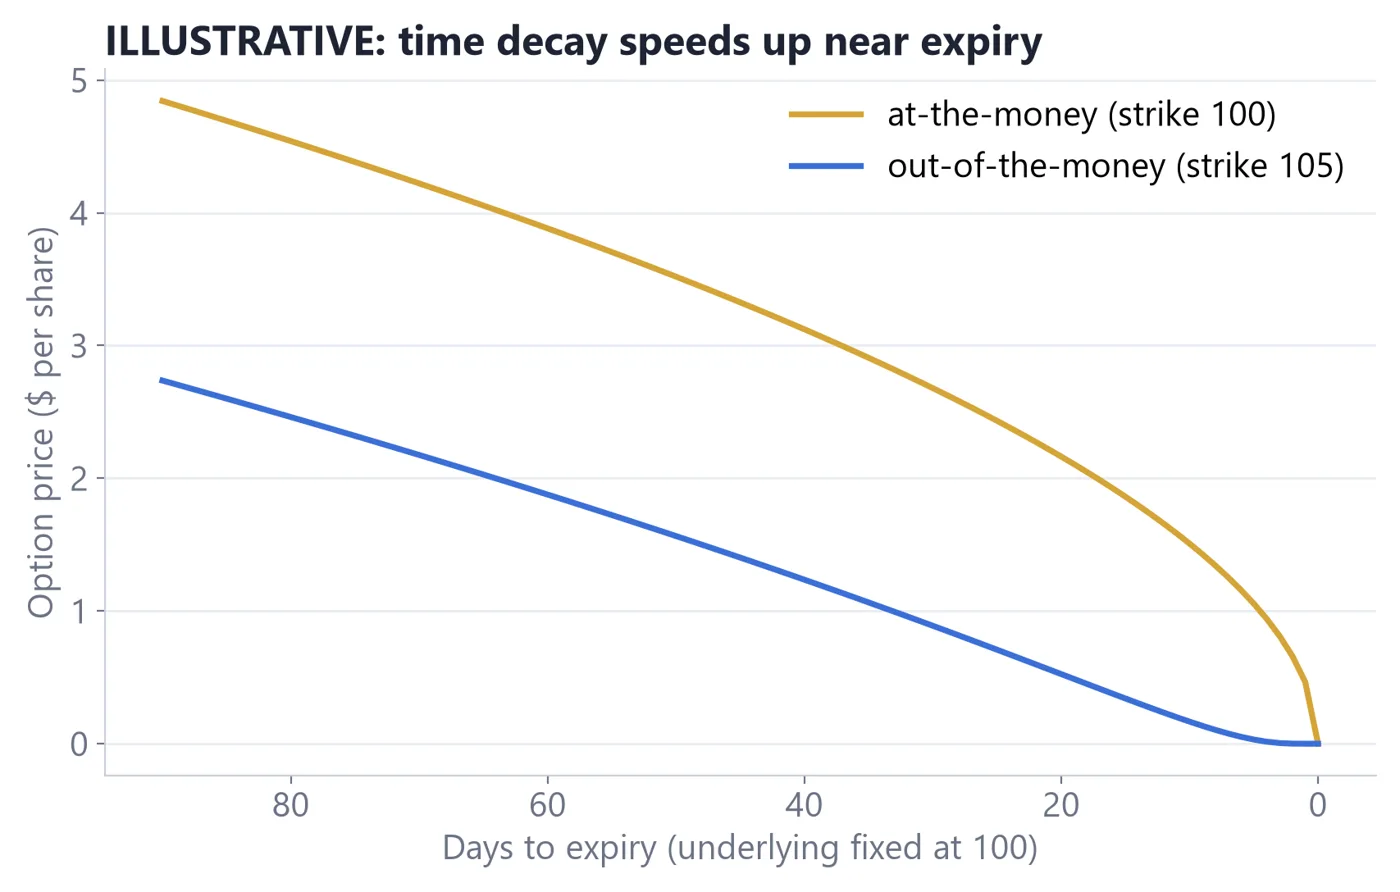
The decay does not happen at an even speed. An option with a long time to run has plenty of room for something to happen, and each passing day takes only a small bite. In the last weeks the remaining chances shrink quickly, and the daily bite grows. At the money, this effect is strongest.
Option value versus days to expiry (illustrative)
How to read it
1Read the chart right to left: expiry is on the left, 30 days out on the right.
2From 30 to 15 days, the line falls gently.
3In the last 10 days, the line steepens.
4At expiry only intrinsic value remains. For an out-of-the-money option that is zero.
Illustrative diagram for teaching. Not real market data.
4.2 A worked illustration
Hypothetical example. SPY stays flat at 600 and implied volatility does not change. An at-the-money 600 call is priced like this on the way to expiry (round, illustrative numbers, not market quotes):
Days left
Call price
Lost from previous row
Per contract
30
4.50
-
-
15
3.20
1.30 over 15 days
$130
5
1.90
1.30 over 10 days
$130
1
0.90
1.00 over 4 days
$100
0
0.00
0.90 in the last day
$90
Total decay is 4.50 - 0.00 = 4.50 per share, or $450 per contract, which is the entire premium. Notice the rate: roughly 1.30 / 15 = 0.09 per day early on, then 1.30 / 10 = 0.13 per day, then 1.00 / 4 = 0.25 per day, then 0.90 in the last single day. The same dollars leak out of a shrinking window.
4.3 Buyers, sellers and an honest caution
Decay works against option buyers and, in a narrow accounting sense, in favour of option sellers. Because of this, premium selling is sometimes promoted as a way to 'collect income'. This guide does not make that claim. The seller accepts the risk of a large move, and the market tends to price that risk into the premium. Selling an option that expires worthless keeps the premium, but one bad move can cost many times that premium. Whether a given approach has an edge after costs is a question for your own tested data, not a promise from a book.
Short-dated options also carry high gamma. They can change value quickly in either direction, and the bid/ask gap is a bigger share of a small premium. A buyer needs the move to arrive soon and be large enough to beat the decay. This is why picking an expiry that gives your idea time to play out matters as much as picking a strike.
Decay also runs over weekends and holidays in the model, so an option held over a quiet weekend can open Monday with less time value even if the underlying has not moved. Check how your broker counts days to expiry before you compare two expiries.
Hypothetical example that fails. A trader buys a 600 call with 5 days left for 1.90 ($190), expecting a bounce. SPY drifts sideways at 600 for four days, then edges to 601. With 1 day left the call is worth about 1.40 (the intrinsic value is 1.00; some time value remains). The trader has lost 0.50 x 100 = $50 even though SPY ended above the strike. A bounce that comes too late is a missed bounce.
Key takeaways
Time value falls to zero at expiry and falls fastest in the last weeks.
A buyer needs the move to be big enough and early enough to beat decay.
Decay benefits sellers on paper, but sellers accept the risk of large moves; it is not guaranteed income.
Choose an expiry that gives your idea room in time.
LESSON 4 · PRACTICE WORKSHEET
Lesson 4 practice: the cost of waiting
You need a calculator and your broker's option chain.
1Mark the point where the line begins to steepen. About how many days from expiry is it?
Show answer
Answers vary by reading, around the last 10 to 15 days; check that the steepening is near expiry, not at the start.
2A hypothetical option is priced 3.00 with 20 days left and 2.40 with 10 days left (flat price, same IV). What is the average daily loss in each, per share and per contract?
Show answer
0.60 over 10 days = 0.06 per share per day = $6 per contract per day.
3Why does a 2-day-to-expiry option cost less in dollars but often more per day than a 30-day option?
Show answer
Less total time value remains, but it decays over fewer days, so each day takes a larger share.
4On your OWN chain, record the at-the-money call ask for SPY at 7, 30 and 60 days. Compute ask divided by days for each.
Show answer
Answers vary: check that the 7-day figure is the largest cost per day.
LESSON 5 · 10 MIN READ
Implied volatility, earnings and IV crush
🎯 You'll learn
What implied volatility is and how it differs from realised movement
Why option prices rise before a known event and fall after it
How a trader can be right on direction and still lose (IV crush)
5.1 Implied volatility
Implied volatility (IV) is the market's pricing of how much the underlying may move, backed out of option prices. It is quoted as an annual percentage. Higher IV means options cost more, because bigger moves are expected. It is not a forecast of direction. It says nothing about up or down.
Realised volatility (also called historical volatility) is how much the price actually moved. When IV is above recent realised movement, options are priced richly by comparison. When IV is below, they are priced cheaply by comparison. Neither condition tells you what happens next. It only helps you see what you are paying.
A futures trader can think of IV like the width of the volume or VWAP bands: it describes how wide the market currently expects the range to be. A wider expected range makes the premium bigger for the buyer and the cushion bigger for the seller.
5.2 Events and IV crush
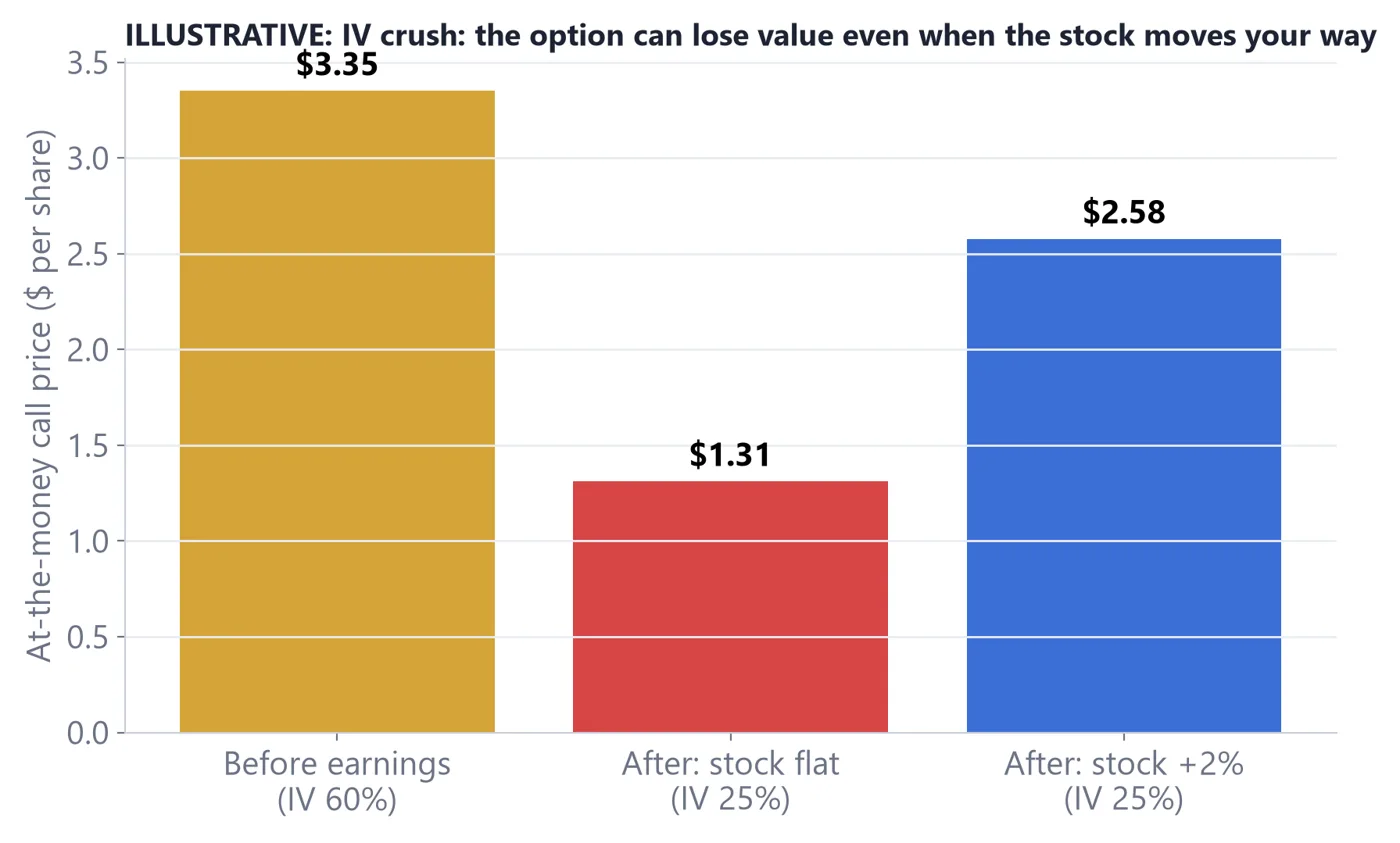
Before a known, scheduled event, such as a company's earnings report, a central-bank decision or a major economic release, IV tends to rise. Traders pay up for options because a large move is possible. Once the event passes and the uncertainty is resolved, IV usually drops sharply. This drop is called IV crush. SPY and QQQ do not report earnings themselves, but the big stocks inside QQQ do, and index-level events like central-bank meetings move their IV too.
Option price before and after an event as IV drops (illustrative)
How to read it
1Before the event, IV is high, so time value is inflated.
2After the event, IV falls sharply and the time value shrinks, even if the underlying moved.
3The final price combines the delta gain from the move and the vega loss from lower IV.
4If vega loss is larger than delta gain, the option falls despite a favourable move.
Illustrative diagram for teaching. Not real market data.
Hypothetical example. A stock trades at 200 the day before earnings. An at-the-money 200 call costs 10.00 with IV at 60%. Assume delta 0.50 and a vega of 0.20 per IV point. The stock rises $4 to 204 after earnings, and IV drops from 60% to 40%, a fall of 20 points. Ignoring theta and gamma to keep the arithmetic simple:
Effect
Arithmetic
Change per share
Delta gain
0.50 x 4
+2.00
Vega loss
0.20 x 20
-4.00
Net
+2.00 - 4.00
-2.00
New call price
10.00 - 2.00
8.00
The call lost 2.00 x 100 = $200 per contract although the stock moved $4 in the buyer's favour. The market had already priced in a big move. The actual move was smaller than what the price implied, so IV deflated. This is the pattern traders mean when they say 'right on direction, wrong on price'.
5.3 Using this knowledge
Understanding IV crush does not tell you what to do. It tells you what to check. Before holding an option through an event, ask: how much move is already priced in? Many platforms show an expected move, an estimate derived from option prices. If your idea needs a move larger than that, you are asking for more than the market expects. If it needs less, you are paying for movement that may not be needed.
Selling options before an event to benefit from IV crush looks attractive in the same way, but the seller takes the risk of the big move. A move larger than the one priced in can cause large losses, especially on undefined-risk positions (Lesson 6). Nothing here is a suggestion to do either; the aim is to know what the price already contains.
Key takeaways
Implied volatility is the market's pricing of expected movement, not of direction.
IV often rises before a known event and drops after it.
A favourable move can still lose money if vega loss exceeds delta gain.
Check how much movement is already priced in before holding through an event.
LESSON 5 · PRACTICE WORKSHEET
Lesson 5 practice: delta gain versus vega loss
You need a calculator and your broker's option chain.
1On the diagram, mark which part of the price drop is due to lower IV. Is the after-event price above or below the before-event price?
Show answer
The drop between the before and after bars is the IV effect; the after price is lower.
2A call costs 6.00, delta 0.50, vega 0.15. The stock rises 2 and IV falls 10 points. What is the new price and the profit or loss per contract?
Show answer
Delta +1.00; vega -1.50; net -0.50. New price 5.50; loss $50.
3Same option, but the stock rises 6 and IV falls 10 points. New price and result?
Show answer
Delta +3.00; vega -1.50; net +1.50. New price 7.50; profit $150.
4On your OWN chain, find the IV of the nearest and next expiry for SPY or QQQ. Is there a notable jump? Name any scheduled event you think explains it.
Show answer
Answers vary: check that two IV figures were written and an event (or none) named.
LESSON 6 · 11 MIN READ
Defined-risk spreads, and why undefined risk needs extra care
🎯 You'll learn
How a vertical spread caps both loss and gain
How an iron condor is built and what its payoff looks like
Why short options with undefined risk, early assignment and pin risk need extra care
6.1 Vertical spreads
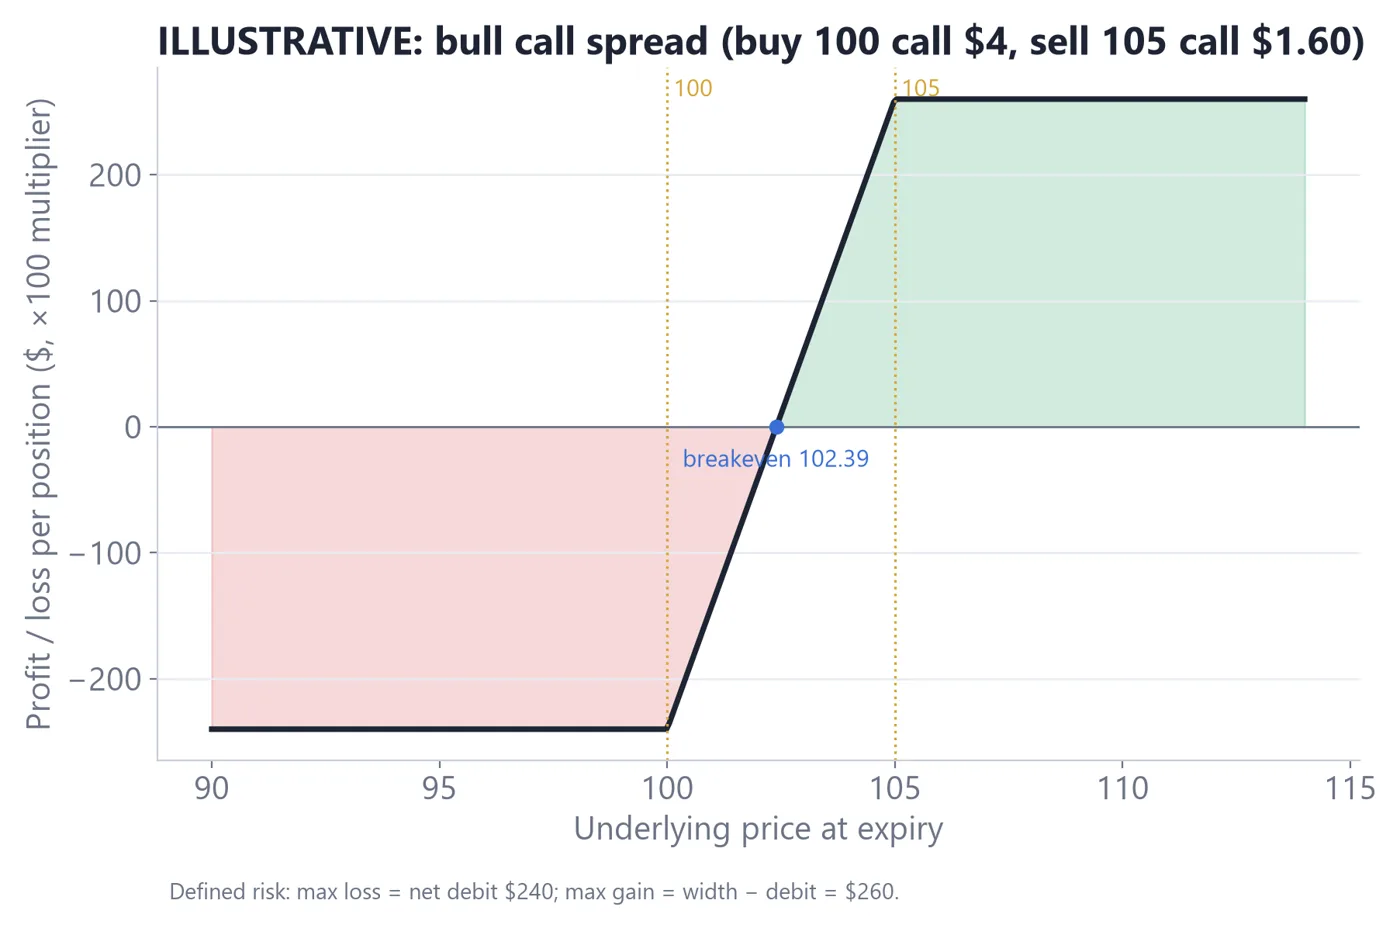
A vertical spread combines two options of the same type and expiry at different strikes: you buy one and sell the other. The option you sell pays for part of the one you buy, and it also limits the gain. The maximum loss and the maximum gain are both known when the trade is opened.
Hypothetical example, bull call spread. SPY is 600. You buy the 600 call for 4.50 and sell the 605 call for 2.50. The net cost (net debit) is 4.50 - 2.50 = 2.00, or 2.00 x 100 = $200. The width between strikes is 605 - 600 = 5.
Bull call spread payoff at expiry (illustrative)
How to read it
1Below 600 both calls expire worthless: the loss is the debit, $200.
2The breakeven is the lower strike plus the debit: 600 + 2.00 = 602.00.
3At 605 and above the gain stops: (5 - 2.00) x 100 = $300.
4Risk is defined: the most you can lose is $200 and the most you can make is $300.
Illustrative diagram for teaching. Not real market data.
Compare it with the single 600 call from Lesson 2: the spread costs $200 rather than $450, and its breakeven is nearer (602.00 versus 604.50), but the gain stops at $300. You gave up the upside above 605 in exchange for lower cost. A bear put spread is the mirror image for a falling market.
6.2 The iron condor
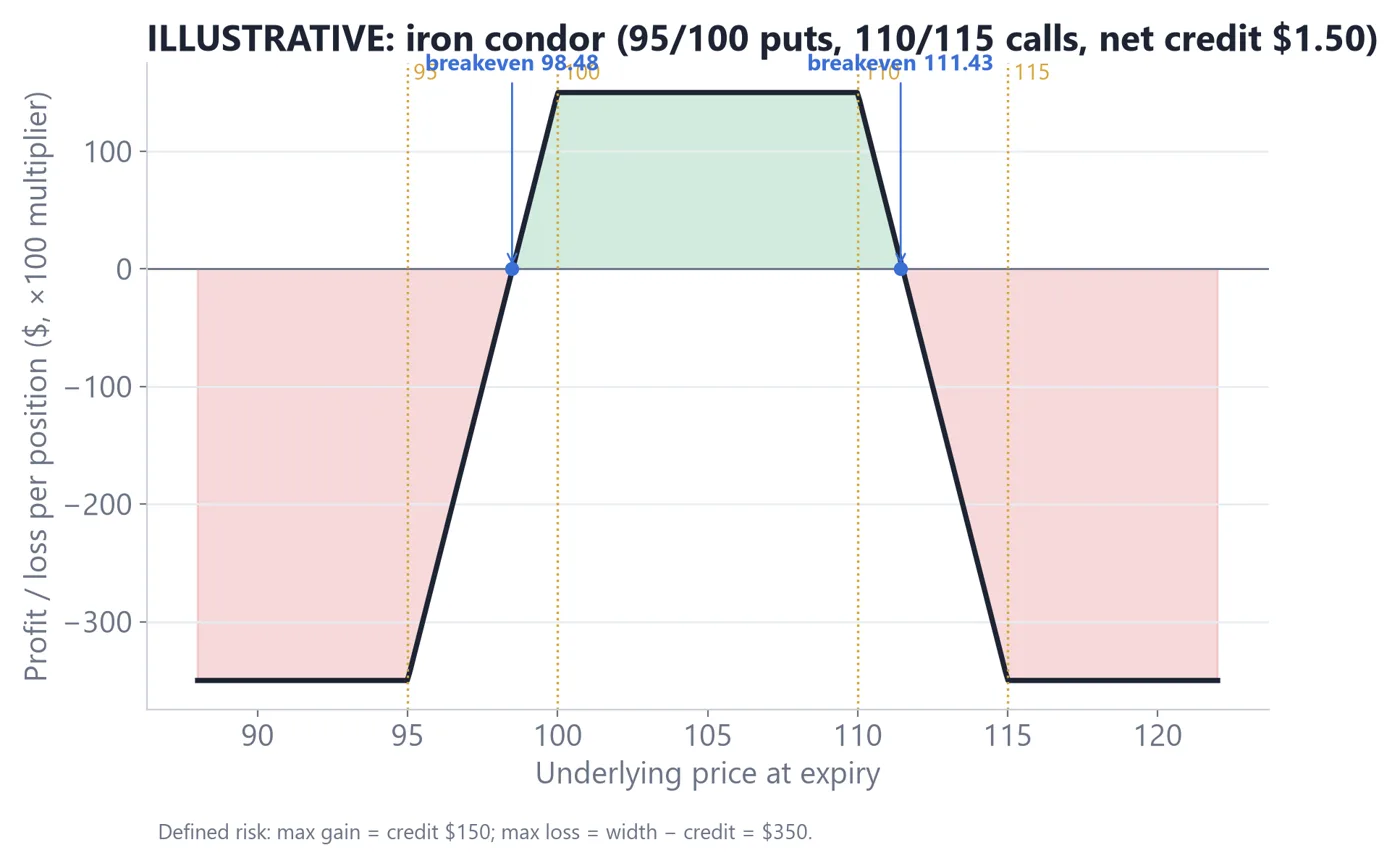
An iron condor combines a put spread below the price with a call spread above it, both sold for a net credit. It has four legs. It earns its maximum if the underlying finishes between the two short strikes, and loses on a big move in either direction.
Hypothetical example. SPY is 600. You sell the 590 put at 1.20 and buy the 585 put at 0.70. You sell the 610 call at 1.30 and buy the 615 call at 0.80. The net credit is 1.20 - 0.70 + 1.30 - 0.80 = 1.00, or $100. Each side is 5 points wide.
Iron condor payoff at expiry (illustrative)
How to read it
1Between 590 and 610 all four options expire worthless and the credit of $100 is kept: this is the maximum gain.
2Breakevens are 590 - 1.00 = 589.00 and 610 + 1.00 = 611.00.
3Beyond 585 or 615 the loss stops growing: (5 - 1.00) x 100 = $400 is the maximum loss.
4The maximum loss ($400) is four times the maximum gain ($100).
Illustrative diagram for teaching. Not real market data.
The shape shows a trade-off: a wide zone where the position keeps a small gain, paid for by a smaller zone where it loses more than it can make. Iron condors are defined-risk, yet the defined loss can still be large compared with the gain. Whether a given setup is worth taking depends on your tested data and your risk limit (Lesson 7). It is not endorsed here.
6.3 Undefined risk, assignment and pin risk
Early assignment. American-style options such as SPY and QQQ can be exercised by the holder at any time. If you have sold an option that is in the money, you can be assigned before expiry, and you receive an obligation to buy or sell 100 shares per contract. This is more likely for deep in-the-money options and for short calls just before a dividend date. In a spread, the long leg can protect against a loss but it does not always arrive in time: you may be assigned shares or a short stock position overnight, with a margin call and a morning decision. Know your broker's rules.
Pin risk. If the underlying finishes very close to a short strike at expiry, you may not know until after the market closes whether you were assigned. A weekend's news can then change the value of the resulting stock position. Many traders close short-option positions before expiry to avoid this uncertainty. On options on futures, assignment gives you a futures position at the strike, with its own margin requirement.
Key takeaways
A vertical spread caps both the loss and the gain; compute max loss, max gain and breakeven before opening one.
An iron condor has a small, wide-zone gain and a larger defined loss.
Naked short calls and puts are undefined risk and can lose more than the account.
Early assignment and pin risk are real for American-style options; know your broker's rules.
LESSON 6 · PRACTICE WORKSHEET
Lesson 6 practice: spreads on paper
You need a pencil and a calculator. The last task uses your own option chain.
1A spread buys the 600 call at 4.50 and sells the 605 call at 2.50. Write the net debit, the breakeven and the maximum gain per contract.
Show answer
Debit 2.00 ($200); breakeven 602.00; maximum gain (5 - 2.00) x 100 = $300.
2An iron condor collects 1.20 credit with 5-wide wings. Write the maximum gain, the maximum loss and the two breakevens if the short strikes are 590 and 610.
Show answer
Max gain $120; max loss (5 - 1.20) x 100 = $380; breakevens 588.80 and 611.20.
3Name three positions that carry undefined risk and say in one sentence why.
Show answer
Examples: naked short call (price can rise without limit), naked short put (large loss if the price collapses), short straddle/strangle (both risks).
4On your OWN chain, price a 5-wide bull call spread on SPY or QQQ about 30 days out. Use ask for the long and bid for the short. Write net debit, max loss, max gain and breakeven.
Show answer
Answers vary: check max loss = debit x 100, max gain = (width - debit) x 100, breakeven = lower strike + debit.
LESSON 7 · 10 MIN READ
Sizing options trades to a fixed account risk, and liquidity
🎯 You'll learn
How to size an options position from its maximum loss
Why some spreads do not fit a small account's risk limit
How bid/ask spread, volume and open interest affect real cost
7.1 Size from the maximum loss
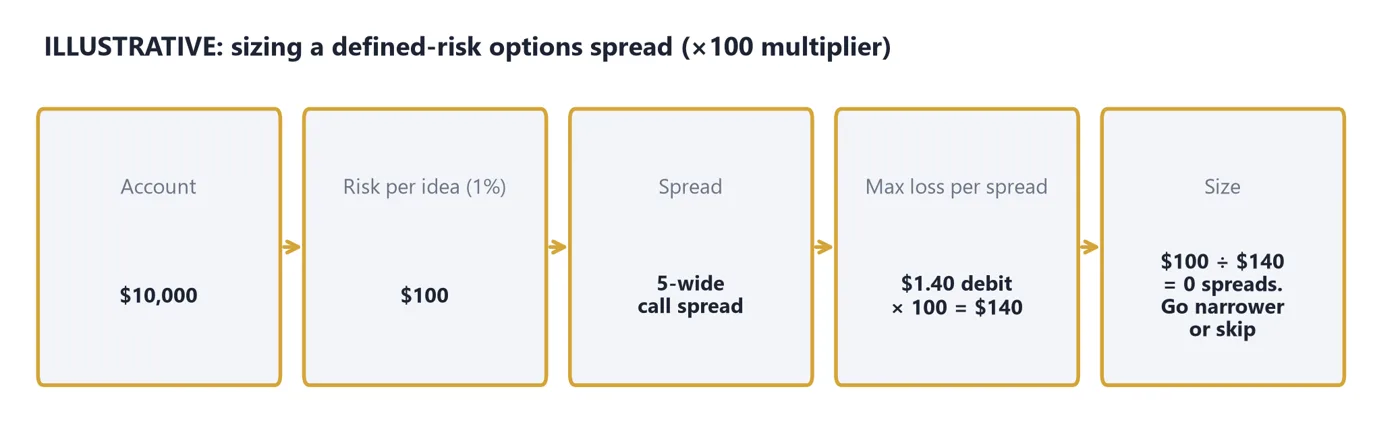
In futures, sizing starts from the stop distance. With a long option or a defined-risk spread, the worst case is known in advance: it is the debit paid, or the width minus the credit received. So sizing starts there. The rule is: contracts = account risk in dollars / maximum loss per contract, rounded down.
Sizing a defined-risk spread to a fixed account risk (illustrative)
How to read it
1Step 1: set the risk budget, for example 1% of the account.
2Step 2: find the maximum loss of one contract: debit x 100, or (width - credit) x 100.
3Step 3: divide the budget by that maximum loss and round down.
4If the answer is below 1, the trade does not fit the budget.
Illustrative diagram for teaching. Not real market data.
Hypothetical example. The account is $25,000 and the risk budget is 1%, which is $250. The 5-wide bull call spread from Lesson 6 has a maximum loss of $200 per contract. 250 / 200 = 1.25, so round down to 1 contract. The actual risk is $200, or 0.8% of the account.
Now the iron condor with a $400 maximum loss. 250 / 400 = 0.625, which rounds down to 0 contracts. The position does not fit the budget, and the correct decision is to skip it or choose a narrower structure. Squeezing in one contract anyway would risk 1.6% of the account.
Hypothetical example, small account. The account is $10,000 and the budget is 1%, or $100. A 1-wide spread with a 0.40 debit has a maximum loss of $40. 100 / 40 = 2.5, so round down to 2 contracts, a total risk of $80. The $200 spread from above gives 100 / 200 = 0.5, which is 0 contracts.
7.2 Liquidity: the cost you cannot see on the chart
Liquidity is how easily you can get in and out at a fair price. In options you check three things. Bid/ask spread: the gap between the best buy and sell prices. Volume: contracts traded today. Open interest: contracts still open from all prior days. High open interest and a tight spread usually mean easier trading. SPY and QQQ options are among the most liquid, but individual strikes and expiries still vary a lot.
Hypothetical example. An option is quoted 1.95 bid and 2.10 ask. The spread is 0.15, which is $15 per contract. The midpoint is (1.95 + 2.10) / 2 = 2.025. If you buy at the ask and could only sell at the bid, the round trip costs 0.15 x 100 = $15 per contract before any price change. On a $210 position that is about 7%. A four-leg trade has four spreads to cross, and the costs add up. Orders at the midpoint or a limit price can reduce this, but they may not fill.
Check
Looks easier to trade
Looks harder to trade
Bid/ask spread
A few cents on a multi-dollar premium
A large share of the premium
Volume today
Hundreds or thousands
Zero or a handful
Open interest
Thousands of contracts
Under a hundred
Strike and expiry
Near the money, standard expiries
Far strikes, unusual dates
Poor liquidity also affects exits. If a spread is hard to close, you may have to hold into expiry or accept a poor price. A stop order on an option can fill far from the trigger because the quoted spread is wide. Many traders use limit orders for options and avoid market orders on thin strikes.
A final note on futures options: ES options have their own multiplier ($50 per point), so the same sizing rule applies but the dollar maximum loss per contract is usually larger. Hypothetical example: an ES call spread with a 10-point debit has a maximum loss of 10 x $50 = $500 per contract, which would not fit a $250 budget at all.
Key takeaways
Contracts = account risk in dollars divided by maximum loss per contract, rounded down.
If the result is below 1, the trade does not fit the budget; skip or restructure it.
Bid/ask spread, volume and open interest are part of the real cost of an options trade.
Multi-leg trades pay the spread on every leg.
LESSON 7 · PRACTICE WORKSHEET
Lesson 7 practice: size and liquidity
You need a calculator and your broker's option chain.
1Account $50,000, risk 0.5%, spread max loss $250. How many contracts, and what is the actual dollar risk?
Show answer
Budget $250; 250 / 250 = 1 contract; risk $250.
2Account $8,000, risk 1%, iron condor max loss $420 per contract. How many contracts? What should you do?
Show answer
Budget $80; 80 / 420 = 0.19, so 0 contracts. The trade does not fit; skip or choose a narrower one.
3A spread is quoted 0.80 bid and 1.00 ask. Compute the width, the midpoint, and the round-trip cost per contract.
4On your OWN chain, pick two strikes: one near the money and one far out of the money (same expiry). Record bid, ask, volume and open interest for each, and compute spread as a percentage of the ask.
Show answer
Answers vary: check that the far strike usually shows a wider percentage spread and lower open interest.
LESSON 8 · 10 MIN READ
Using futures-style context for strikes and timing
🎯 You'll learn
How VWAP and its bands give context for option timing
How value areas and key levels can frame strike choice
How to log a failed idea and a skipped idea, and why both matter
8.1 Context, not a signal
If you read charts as a futures trader, you already own useful tools: VWAP (the volume-weighted average price for the session), its standard-deviation bands, value areas, and key levels like prior highs and lows. Options do not replace these tools. They change the question. For futures you ask 'where do I enter and where is my stop?' For options you also ask 'where is my breakeven, how much time do I have, and what am I paying for volatility?'
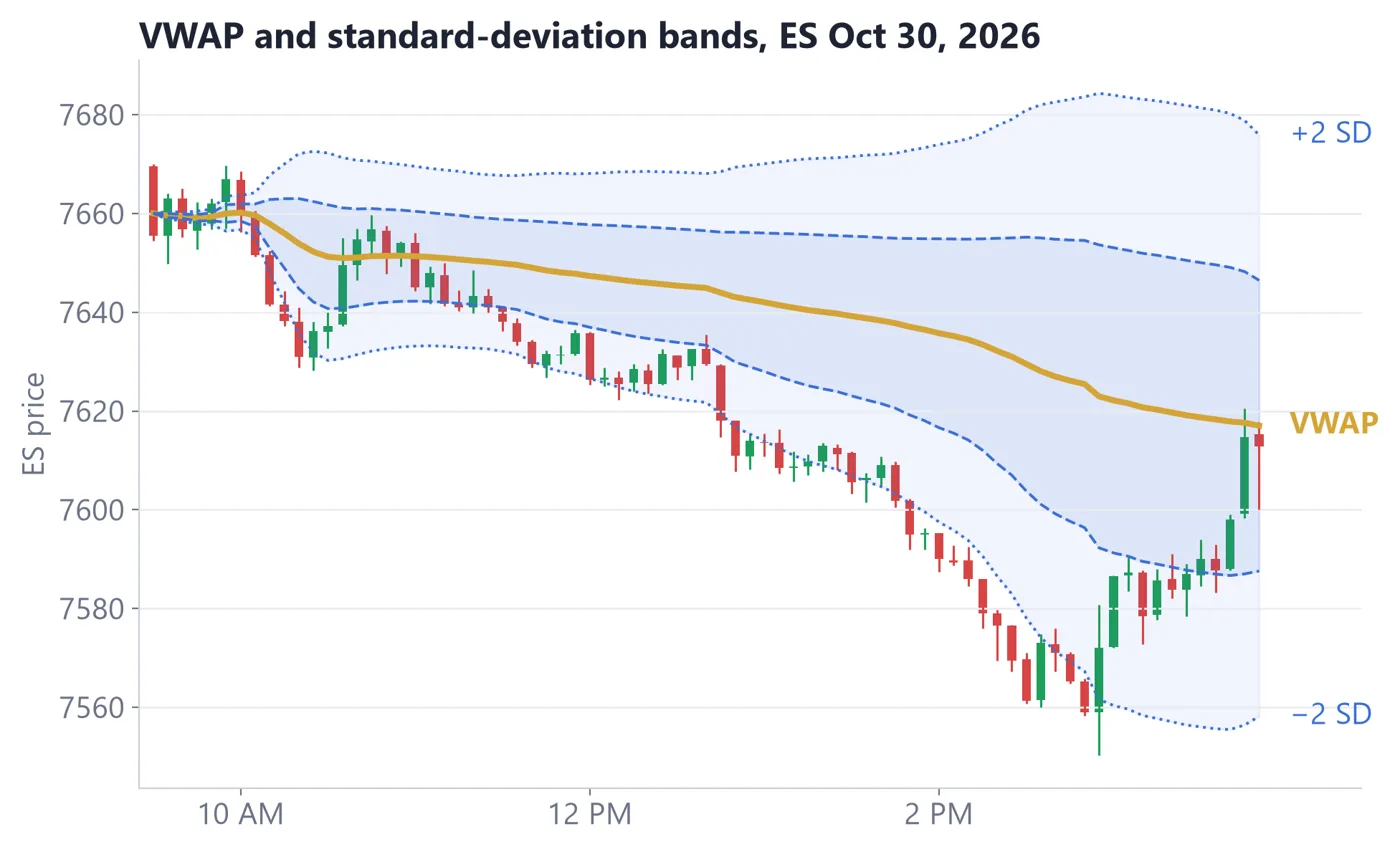
Chart context cannot tell you what will happen. It can show whether the price is sitting inside the day's usual range or living outside it, and that affects which questions are reasonable. This lesson uses the same ES charts as the earlier guides. Prices there are real ES futures; all option numbers here are hypothetical.
VWAP with plus and minus 1 and 2 standard deviation bands on the Oct 30 trend day (ES)
How to read it
1VWAP is the running volume-weighted average price for the session.
2The inner bands mark 1 standard deviation from VWAP and the outer bands mark 2.
3On a trend day, price can stay beyond the bands for hours instead of snapping back.
4A reversion idea needs a different plan than a trend idea.
Real ES futures data (Yahoo Finance ES=F, 5-minute bars, regular session 9:30 AM–4:00 PM ET). Volume at price is approximated by spreading each 5-minute bar's volume across the prices it traded through.
8.2 Value area and strike choice
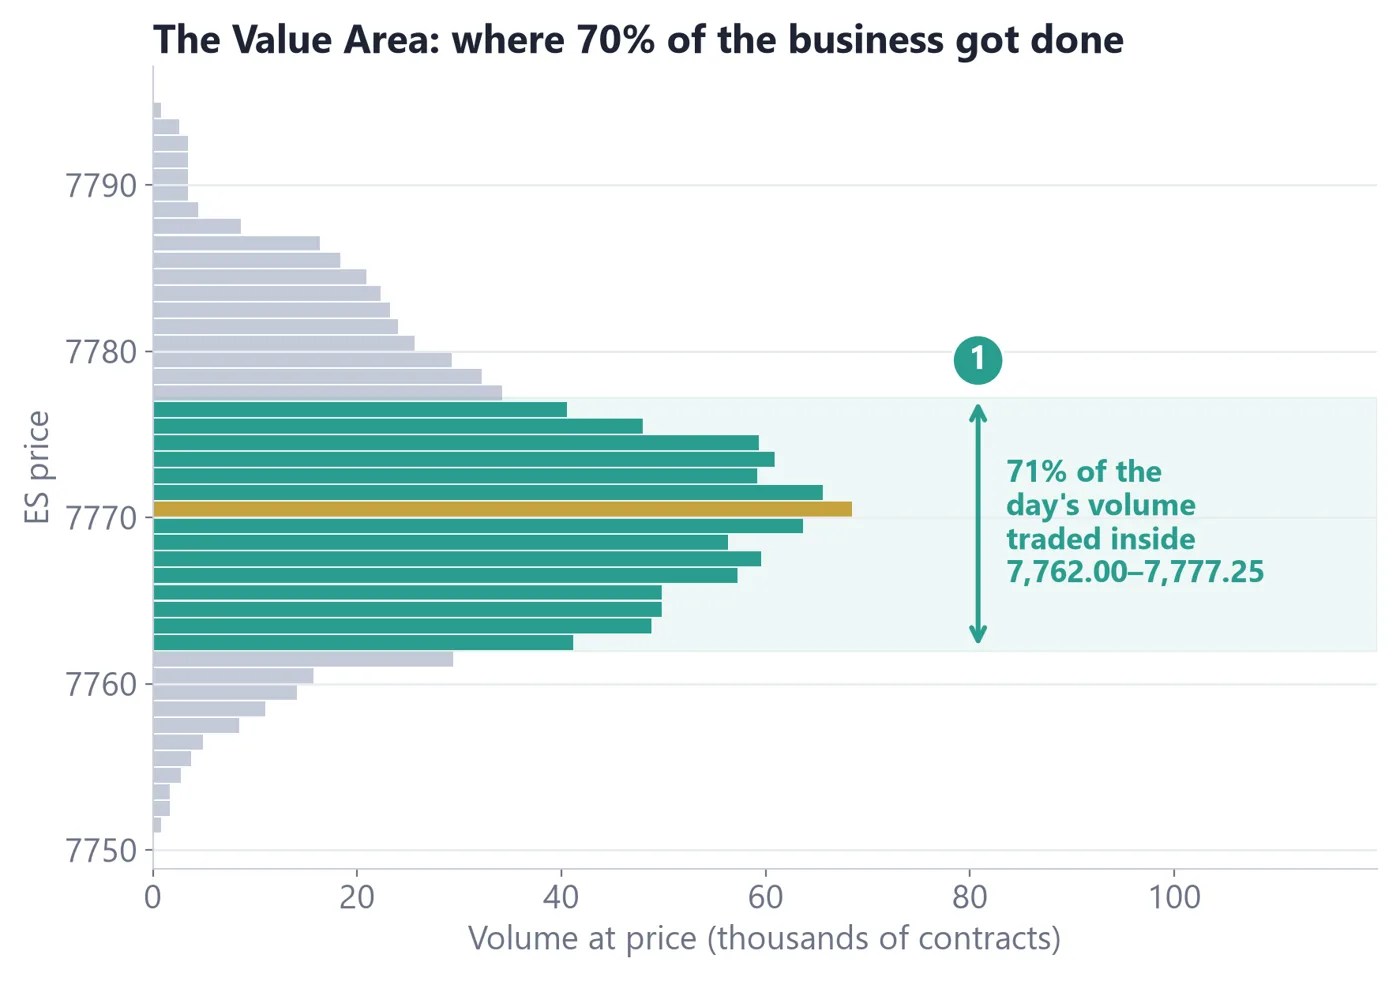
A value area is the price range containing about 70% of a day's volume, with a point of control (POC) at its busiest price. Some traders watch the previous day's value area high (VAH), low (VAL) and POC as levels where price tends to react, or fail to. Context, not a prediction.
70% value area shaded on a real ES day
How to read it
1The shaded zone holds about 70% of the volume.
2The VAH and VAL are the upper and lower edges.
3Price acceptance outside the value area is consistent with a shift; a quick return inside is consistent with rejection.
4These are observations, not rules.
Real ES futures data (Yahoo Finance ES=F, 5-minute bars, regular session 9:30 AM–4:00 PM ET). Volume at price is approximated by spreading each 5-minute bar's volume across the prices it traded through.
How does this help with options? In three small ways. First, breakeven check: if the breakeven of a call sits beyond a nearby key level that has stopped price before, the idea needs more than a simple move. Second, timing: the premium decays daily, so waiting inside a quiet range costs money. Third, risk definition: an idea that fails if price closes back inside the value area can be matched to a spread whose maximum loss you have already sized (Lesson 7).
A reminder on SPY versus ES: SPY moves in roughly the same direction as ES, but you must convert levels yourself, and the cash market hours differ from the nearly 24-hour futures session. All the SPY numbers below are round placeholders, not conversions of real levels.
8.3 Two hypotheticals: one fails, one is skipped
Hypothetical example that fails. On a day shaped like the Oct 30 trend day, a trader sees price stretched below the lower 2-standard-deviation band and thinks 'it must snap back to VWAP'. SPY is 600 hypothetically. The trader buys a one-day 600 call for 1.20, paying 1.20 x 100 = $120. Price stays beyond the bands and keeps falling to 595 by the close. The call expires worthless, and the loss is the full $120, or 100% of the premium. The mistake was not the loss itself; it was treating a stretched price as a reason when the day was a trend day. The trade log should say: 'Did not check whether the day looked like a trend or a reversion day before buying a one-day option.'
Hypothetical example that is skipped. SPY is 600 and sits in the middle of yesterday's value area. A trader likes the idea of a bounce toward the value area high, 4 points away at 604. The 600 call with 7 days left is quoted 1.60 bid and 2.00 ask. The breakeven is 600 + 2.00 = 602.00, so the 604 target is only 2 points past breakeven. At expiry the call would then be worth 4.00 against 2.00 paid, a gain of $200 at best, for $200 at risk. The bid/ask gap alone costs 0.40 x 100 = $40 round trip, which is 20% of that best-case gain. Price is mid-range with no nearby level to react to. The trader writes 'skipped: breakeven too close to the target, spread too wide, no location edge' and takes no trade. A skipped trade with a written reason is a good outcome.
A pre-trade context checklist (not a signal)
1Is the day behaving like reversion or trend? (VWAP bands)
2Where are the value area and key levels relative to the breakeven?
3Does the expiry give the idea enough time?
4Does the maximum loss fit the sized risk budget?
5Is the spread tight and the open interest healthy?
6If any answer is no: skip and log the reason.
Key takeaways
VWAP, bands, value areas and key levels are context for options, not signals.
Compare the breakeven with nearby levels and check the expiry gives your idea enough time.
A trend day can keep price beyond the bands, which is a risk for reversion ideas, especially in short-dated options.
Log failed and skipped ideas with reasons; both teach.
LESSON 8 · PRACTICE WORKSHEET
Lesson 8 practice: context before the trade
You need a pencil. The last tasks use your own live chart and option chain.
1Mark the periods when price stayed outside the 1 SD band for more than an hour. Does this day look like reversion or trend?
Show answer
Trend: price stayed beyond the bands for long stretches.
2Mark the VAH, the VAL and the POC. Which is nearest the closing price?
Show answer
Answers vary by reading: check that all three were marked and the nearest was named.
3A hypothetical call has strike 600, ask 2.00, and your target is 603. Is the target above or below the breakeven? What does that say?
Show answer
Breakeven 602.00; the target is only 1 point above, so the gain is $100 against $200 paid. The idea does not pay on that target.
4On your OWN live chart (ES, SPY or a stock), add VWAP with bands and write whether today looks like a reversion or a trend day, with one reason.
Show answer
Answers vary: check that one reason from the chart was given.
5On your OWN option chain, take one idea from your chart and decide: take, skip or restructure. Write the breakeven, the maximum loss, the sized contract count and the spread percentage.
Show answer
Answers vary: check that all four numbers and a written decision are present.
Quick check answers
Lesson 1: Q1 C, Q2 A, Q3 B
Lesson 2: Q1 C, Q2 A, Q3 A
Lesson 3: Q1 B, Q2 A, Q3 B
Lesson 4: Q1 B, Q2 A, Q3 B
Lesson 5: Q1 B, Q2 A, Q3 B
Lesson 6: Q1 B, Q2 C, Q3 A
Lesson 7: Q1 A, Q2 B, Q3 A
Lesson 8: Q1 B, Q2 A, Q3 B
Worksheet answer key
Lesson 1: Lesson 1 practice: read the chain
Answers vary by snapshot: check that cost = call ask x 100.
Check that the ITM call has a strike below the current price and the OTM call has a strike above it.
Buy: 3.25 x 100 = $325. Sell: 3.10 x 100 = $310.
Answers vary: check that cost = ask x 100 and that open interest is written down.
25 x $50 = $1,250.
Lesson 2: Lesson 2 practice: breakeven and payoff
Breakeven 604.50. At 612 the call is worth 12.00; profit per share 7.50; per contract $750.
Breakeven 595. At 603 the put expires worthless: loss $500.
Breakeven 503.20. Maximum loss 3.20 x 100 = $320.
Answers vary: check that breakeven = strike + ask and the percentage = (breakeven - price) / price.
Lesson 3: Lesson 3 practice: Greeks in dollars
About 0.50 = at the money; near 0 = far out of the money; near 1.00 = deep in the money.
4 x 100 x 0.25 = 100 shares. Gain about 100 x 3 = $300 for small moves.
0.08 x 100 x 2 = $16 per day.
0.12 x 4 = 0.48 per share; x 100 = $48.
Answers vary: check that each Greek was multiplied by 100.
Lesson 4: Lesson 4 practice: the cost of waiting
Answers vary by reading, around the last 10 to 15 days; check that the steepening is near expiry, not at the start.
0.60 over 10 days = 0.06 per share per day = $6 per contract per day.
Less total time value remains, but it decays over fewer days, so each day takes a larger share.
Answers vary: check that the 7-day figure is the largest cost per day.
Lesson 5: Lesson 5 practice: delta gain versus vega loss
The drop between the before and after bars is the IV effect; the after price is lower.
Delta +1.00; vega -1.50; net -0.50. New price 5.50; loss $50.
Delta +3.00; vega -1.50; net +1.50. New price 7.50; profit $150.
Answers vary: check that two IV figures were written and an event (or none) named.
Lesson 6: Lesson 6 practice: spreads on paper
Debit 2.00 ($200); breakeven 602.00; maximum gain (5 - 2.00) x 100 = $300.
Max gain $120; max loss (5 - 1.20) x 100 = $380; breakevens 588.80 and 611.20.
Examples: naked short call (price can rise without limit), naked short put (large loss if the price collapses), short straddle/strangle (both risks).
Answers vary: check max loss = debit x 100, max gain = (width - debit) x 100, breakeven = lower strike + debit.
Lesson 7: Lesson 7 practice: size and liquidity
Budget $250; 250 / 250 = 1 contract; risk $250.
Budget $80; 80 / 420 = 0.19, so 0 contracts. The trade does not fit; skip or choose a narrower one.