FREE SUPPLEMENT 3 OF 5 · TO LEARN TO TRADE IN 31 DAYS
Derivatives Part I: Futures & Prop Trading
How futures contracts work, what they cost to hold, and how prop evaluations really operate
9 lessons~87 minBeginner to intermediate5 printable worksheets
Educational only. Not financial advice. Futures trading involves substantial risk of loss and is not suitable for every investor. Past market behaviour shown here does not predict future results.
WHITE FEATHER FINANCE
Important: please read
Educational only. Not financial advice. This book teaches how traders read market data and manage risk. It does not tell you what to buy or sell.
Trading involves substantial risk of loss. Futures are leveraged and can lose more than your deposit. Options can expire worthless, and selling options can lose far more than the premium received. Only trade money you can afford to lose.
Past market behaviour does not predict future results. Charts and examples are historical or hypothetical, for illustration only. Rules of thumb quoted from trading literature are heuristics, not guarantees.
White Feather Finance is an education company, not a registered investment adviser, broker-dealer or commodity trading advisor.
How to use this book
This guide is for beginner to intermediate traders who want to understand futures before they trade them. A futures contract is a standard agreement to buy or sell something at a set price on a set date. Most retail traders never hold one to that date. They trade the price moves in between, using a small deposit.
You will learn how to read a contract code such as ESZ6, how tick size and tick value turn price moves into dollars (ES, MES, NQ, MNQ, CL and GC), how margin and leverage work and why a loss can be bigger than your deposit, how the nearly 24-hour session, the daily break and roll week shape your day, and how proprietary (prop) firm evaluations are generally structured and why many people do not pass them.
The guide ends with four practical lessons on a study framework, a pre-market routine, platforms and data, and case studies. Those lessons are appended from an existing guide. Everything here is educational. Hypothetical examples are labelled, and none is a trade recommendation or a promise of results. Futures trading involves substantial risk of loss.
Before you start: None. If you can read a candlestick chart, you are ready. Supplement 5 (Psychology & Risk Management) pairs well with Lessons 3 and 5.
📖 ReadPlain-English explanations; every term is in the glossary.
📊 SeeEvery concept has a chart or a labelled diagram.
🛠️ DoA 5-minute "Try it" task and a 3-question quick check, plus a printable worksheet for each lesson.
🎬 WatchShort companion videos on YouTube @WFeatherFinance.
What a futures contract is and why it is standardised
How to read expiry months and codes such as ESZ6
Cash versus physical settlement, and why most retail traders close or roll before expiry
1.1 A standard promise
A futures contract is an agreement to buy or sell a set amount of something at a price agreed today, with the exchange of money and goods happening on a set future date. The thing being traded is called the underlying. It might be a stock index, crude oil, gold or a currency.
Futures began as a tool for businesses. A farmer wants to lock in a selling price before harvest. A bakery wants to lock in a buying price for wheat. Each side agrees a price now so that neither is surprised later. Speculators, including retail traders, take the other side of these agreements. They are not trying to own wheat or oil. They are trying to profit from the price moving.
The key idea is standardisation. Every contract of the same type is identical: same size, same quality, same expiry date, same rules. Because all ES contracts for one month are interchangeable, buyers and sellers can find each other quickly, and the price you see is the price for a known product. An exchange (for example CME Group in the United States) runs the market, and a clearing house stands between every buyer and seller so each side only has to trust the clearing house.
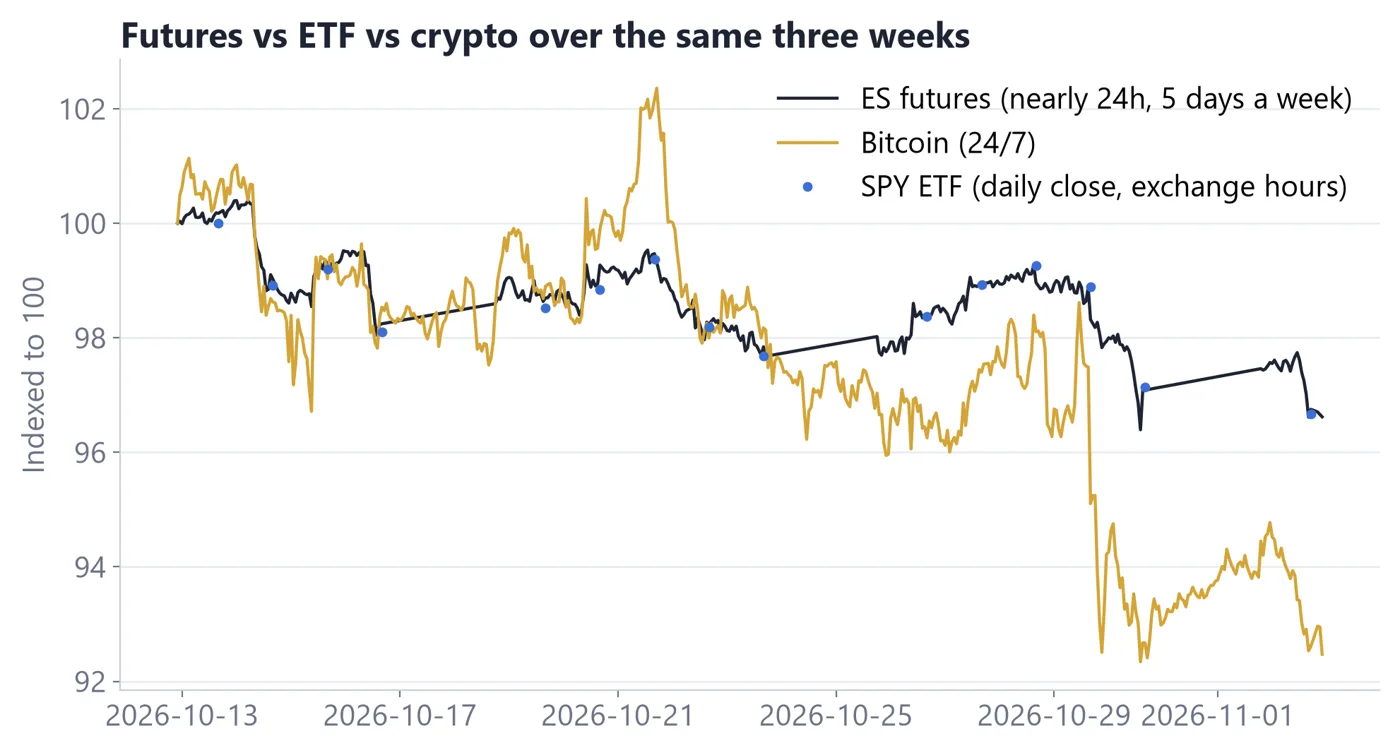
ES futures, the SPY ETF and Bitcoin on one normalised chart
How to read it
1ES is a futures contract on the S&P 500 index. SPY is an exchange-traded fund, a basket of shares.
2The two track the same index closely, but they are different products with different rules.
3Bitcoin trades all day, every day. Futures trade almost all day, with a short daily break.
Real ES futures data (Yahoo Finance ES=F, 5-minute bars, regular session 9:30 AM–4:00 PM ET). Volume at price is approximated by spreading each 5-minute bar's volume across the prices it traded through.
1.2 Reading a contract code
Each contract has a code made of three parts: the root symbol for the product, a month letter, and a year digit. Take ESZ6. ES is the E-mini S&P 500. Z is the month, December. 6 is the year, 2026. So ESZ6 is the E-mini S&P 500 contract that expires in December 2026.
The month letters are fixed by the industry. Equity index futures such as ES and NQ expire only in four months: March, June, September and December. They are called the quarterly cycle. Other markets, such as crude oil, have a contract for almost every month.
Letter
Month
Letter
Month
F
January
N
July
G
February
Q
August
H
March
U
September
J
April
V
October
K
May
X
November
M
June
Z
December
A chart labelled ES1! on TradingView is a stitched series of the front (nearest) contract, so it is a convenient chart but not a single tradable contract. When you place an order, you must pick a specific month, such as ESZ6 or ESH7 (March 2027). Picking the wrong month is a common beginner slip, so read the code before every order.
1.3 Settlement and why most close or roll
Settlement is what happens when a contract reaches its expiry. There are two kinds. With cash settlement, no goods change hands. The exchange compares your entry price to a final settlement price and moves the difference in cash. ES and NQ are cash settled. With physical settlement, the real thing is delivered. Crude oil (CL) and gold (GC) are physically settled, which means an unclosed position near expiry can lead to a delivery process that a retail account is not set up for.
Most brokers protect you from this. They set a deadline well before expiry and may close your position automatically, sometimes with a fee, and they can do so at a price you would not choose. The practical rule for retail traders is simple: do not carry a position into expiry unless you have read your broker's rules and fully understand them.
That is why most retail traders either close the position before expiry or roll it. Rolling means closing the expiring contract and opening the same position in the next month. Lesson 4 covers roll week in detail. For now, remember that every futures position has a clock on it, and the clock is the expiry date.
Hypothetical example: you buy 1 ES at 5,000.00 and later sell it at 5,010.00. The move is 10 points. Each ES point is worth $50, so the gross result is 10 x $50 = $500 before fees. Nothing was delivered and you never needed to wait for expiry. You simply closed the trade. That is how the great majority of retail futures trades end.
Key takeaways
A futures contract is a standardised agreement; the exchange and clearing house make every contract of a type identical.
A code has three parts: product, month letter and year digit. ESZ6 is the E-mini S&P 500 for December 2026.
ES and NQ settle in cash; CL and GC settle physically, so know the settlement type before trading.
Every position has an expiry clock. Close or roll before your broker's deadline unless you fully understand the process.
LESSON 1 · PRACTICE WORKSHEET
Lesson 1 practice: contracts and codes
Pencil and the month-letter table. A free TradingView chart helps with the last task.
1Decode NQM7: product, month and year.
Show answer
NQ (E-mini Nasdaq-100), M = June, 7 = 2027. So June 2027.
2Hypothetical example: you buy 1 ES at 5,000.00 and sell at 5,012.50. How many points and how many dollars (gross)?
Show answer
12.5 points x $50 = $625 gross, before fees.
3On the chart, name one way the Bitcoin line differs in availability from the ES line (hint: trading hours).
Show answer
Answers vary: check that you note Bitcoin trades 24/7 with no daily break, while ES trades nearly 24 hours with a short daily maintenance break.
4On your own live chart (any futures symbol), write the exact code of the front-month contract and its settlement type (cash or physical).
Show answer
Answers vary: check that the code has a root, a month letter and a year digit, and that the settlement type matches the product's contract specification on the exchange website.
LESSON 2 · 10 MIN READ
Contract specs and tick maths
🎯 You'll learn
What a tick, a point and a tick value are
The specs for ES, MES, NQ, MNQ, CL and GC
How to turn a price move into dollars, and a contract into notional value
2.1 Ticks, points and dollars
Prices on a futures market move in fixed steps. The smallest step is the tick. The tick size is how far price moves in one tick, and the tick value is how many dollars one tick is worth for one contract. A point is a bigger unit, usually a whole number on the price, and the point value is the dollars per point.
For ES the tick size is 0.25 index points and the tick value is $12.50. There are four ticks in a point, so the point value is 4 x $12.50 = $50. If ES moves from 5,000.00 to 5,001.00, that is 4 ticks, or one point, and one contract gains or loses $50.
Always check the official contract specification on the exchange website before you trade. Specs can change, and the numbers below are the ones this guide uses for teaching.
Contract
Underlying
Tick size
Tick value
Point value
ES
E-mini S&P 500
0.25
$12.50
$50
MES
Micro E-mini S&P 500
0.25
$1.25
$5
NQ
E-mini Nasdaq-100
0.25
$5.00
$20
MNQ
Micro E-mini Nasdaq-100
0.25
$0.50
$2
CL
Crude oil (1,000 barrels)
0.01
$10
$1,000
GC
Gold (100 troy ounces)
0.10
$10
$100
Notice that the micros are one tenth the size of their full-size cousins. MES is one tenth of ES, and MNQ is one tenth of NQ. That makes micros a way to take smaller risk while you learn.
2.2 Worked tick maths
The method is the same for every market: move in ticks x tick value x number of contracts. Here are four hypothetical examples. All prices are made up for teaching.
Hypothetical example, ES: a long position moves from 5,000.00 to 5,007.50. That is 7.50 points, or 7.50 / 0.25 = 30 ticks. 30 x $12.50 = $375. Check by points: 7.5 x $50 = $375.
Hypothetical example, MNQ: price falls 20 points against a long position. 20 / 0.25 = 80 ticks. 80 x $0.50 = $40 per contract. With 3 contracts the loss is 3 x $40 = $120. Check by points: 20 x $2 = $40.
Hypothetical example, CL: crude moves 0.35 against you. 0.35 / 0.01 = 35 ticks. 35 x $10 = $350 per contract. A move of a full dollar in crude is 100 ticks, or $1,000. Oil is a fast market for its size.
Hypothetical example, GC: gold rises 5.00. 5.00 / 0.10 = 50 ticks. 50 x $10 = $500 per contract. Check by points: 5 x $100 = $500.
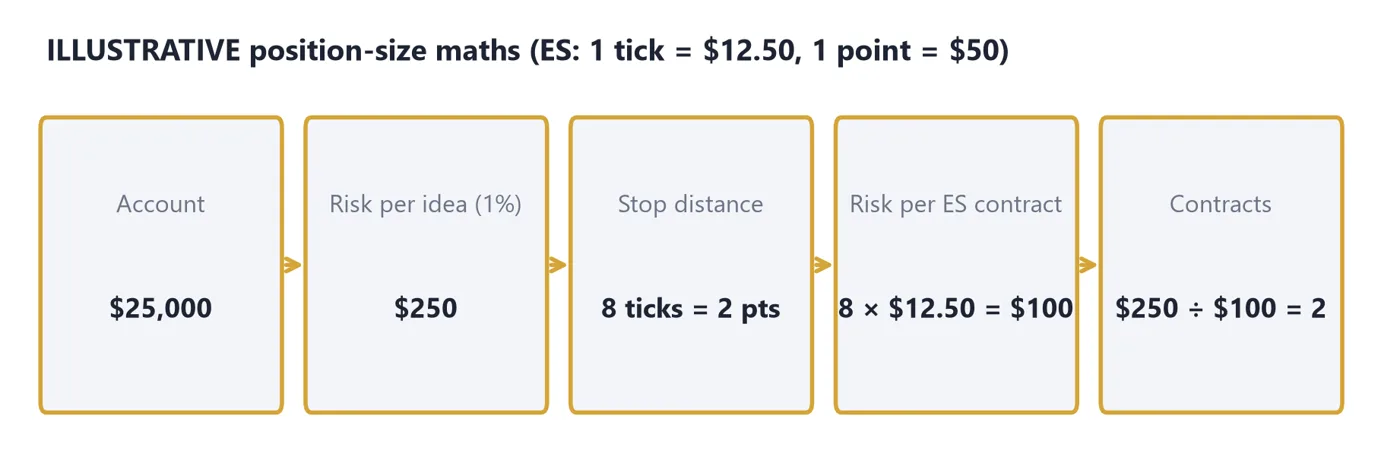
Stop distance in ticks to dollars to contracts for a fixed account risk
How to read it
1Start with the dollars you are willing to lose on the trade.
2Convert your stop distance into ticks, then into dollars per contract.
3Divide the first number by the second and round down to a whole number of contracts.
Illustrative diagram for teaching. Not real market data.
2.3 Notional value, and a skipped trade
Notional value is the full value of what the contract controls: price x point value. Hypothetical example: if ES is at 5,000, one contract controls 5,000 x $50 = $250,000 of index exposure. One MES controls 5,000 x $5 = $25,000. If NQ is at 18,000, one contract controls 18,000 x $20 = $360,000, and one MNQ controls $36,000. A crude contract at $70 controls 70 x $1,000 = $70,000.
Notional value matters because your profit and loss follow the full amount, not the small deposit you put down. Lesson 3 covers that deposit. Here, just notice that a single contract can control a very large number.
Hypothetical example (skipped trade): your account is $5,000 and your plan risks 1%, which is $50. You spot a setup on MES with a stop 12 points away. 12 points = 48 ticks. 48 x $1.25 = $60 for one contract. Because $60 is more than your $50 limit, even one contract breaks the plan. A trader who follows the plan skips the trade or finds a tighter, still logical stop. Taking one contract anyway and calling it close enough is how risk rules quietly break.
Key takeaways
Move in ticks x tick value x contracts equals the dollar result.
ES $12.50, MES $1.25, NQ $5.00, MNQ $0.50, CL $10 and GC $10 per tick; always confirm on the exchange site.
Notional value (price x point value) shows how much the contract really controls.
If the stop in dollars is bigger than your risk limit even for one contract, skipping the trade is the plan working.
LESSON 2 · PRACTICE WORKSHEET
Lesson 2 practice: tick maths
Pencil and a calculator. Show your working.
1Hypothetical example: you hold 2 NQ and price moves 15 points against you. What is the loss?
Show answer
15 / 0.25 = 60 ticks x $5.00 = $300 per contract x 2 = $600. Check: 15 x $20 x 2 = $600.
2Your risk limit is $80. A GC stop is 1.50 away. Does one contract fit?
Show answer
1.50 / 0.10 = 15 ticks x $10 = $150. That is more than $80, so one contract does not fit; skip or find a tighter logical stop.
3Following the steps on the chart, size this: risk $100, MES stop of 8 points. How many contracts?
Show answer
8 points = 32 ticks x $1.25 = $40 per contract. $100 / $40 = 2.5, round down to 2 contracts.
4On your own live chart of MES or MNQ, measure the distance between a recent swing low and swing high in points, then convert it to ticks and to dollars for 1 contract.
Show answer
Answers vary: check that ticks = points x 4, and dollars = ticks x $1.25 for MES or ticks x $0.50 for MNQ.
LESSON 3 · 10 MIN READ
Margin, leverage and losing more than your deposit
🎯 You'll learn
The difference between initial margin, maintenance margin and day-trade margin
What a margin call is and how leverage magnifies gains and losses
How a 1% risk rule keeps position size sane, and why losses can exceed your deposit
3.1 Margin is a deposit, not a down payment
Margin in futures is a good-faith deposit. It is not a loan to buy the contract and it is not a fee. It is money set aside in your account to show you can cover losses. The amount is a small slice of the contract's notional value, which is why futures are called a leveraged product.
Initial margin is the amount needed to open a position and hold it overnight. Maintenance margin is the minimum balance you must keep while the position is open. If your account equity falls below maintenance margin, you may get a margin call, a demand to add money or reduce the position. Brokers can also close positions without asking.
Many brokers also offer day-trade margin (also called intraday margin). It is a much lower requirement that applies only if you close the position before the session ends. It varies a lot by broker, and brokers can change it, even raise it quickly in fast markets. The exchange sets the base requirement and the broker may ask for more. Always read your own broker's current margin page.
The numbers in this lesson are hypothetical. Do not treat them as current requirements.
3.2 Leverage works in both directions
Leverage means a small amount of money controls a large position. Hypothetical example: ES is at 5,000, so one contract has a notional value of $250,000. Suppose initial margin is $12,000. Leverage is about $250,000 / $12,000 = 20.8 to 1.
Now watch what a 1% move does. 1% of 5,000 is 50 points. 50 points x $50 = $2,500. If your account holds $15,000, a 1% market move equals $2,500 / $15,000 = 16.7% of your account. The same arithmetic works for gains and for losses. Leverage does not change the odds. It changes the size of the swing.
Hypothetical example (margin call): you have $15,000 and hold 1 ES. Suppose maintenance margin is $11,000. Price falls 90 points. 90 x $50 = $4,500 loss. Your equity is now $15,000 - $4,500 = $10,500, which is below $11,000. You may receive a margin call, or the broker may close the trade for you, locking in the loss.
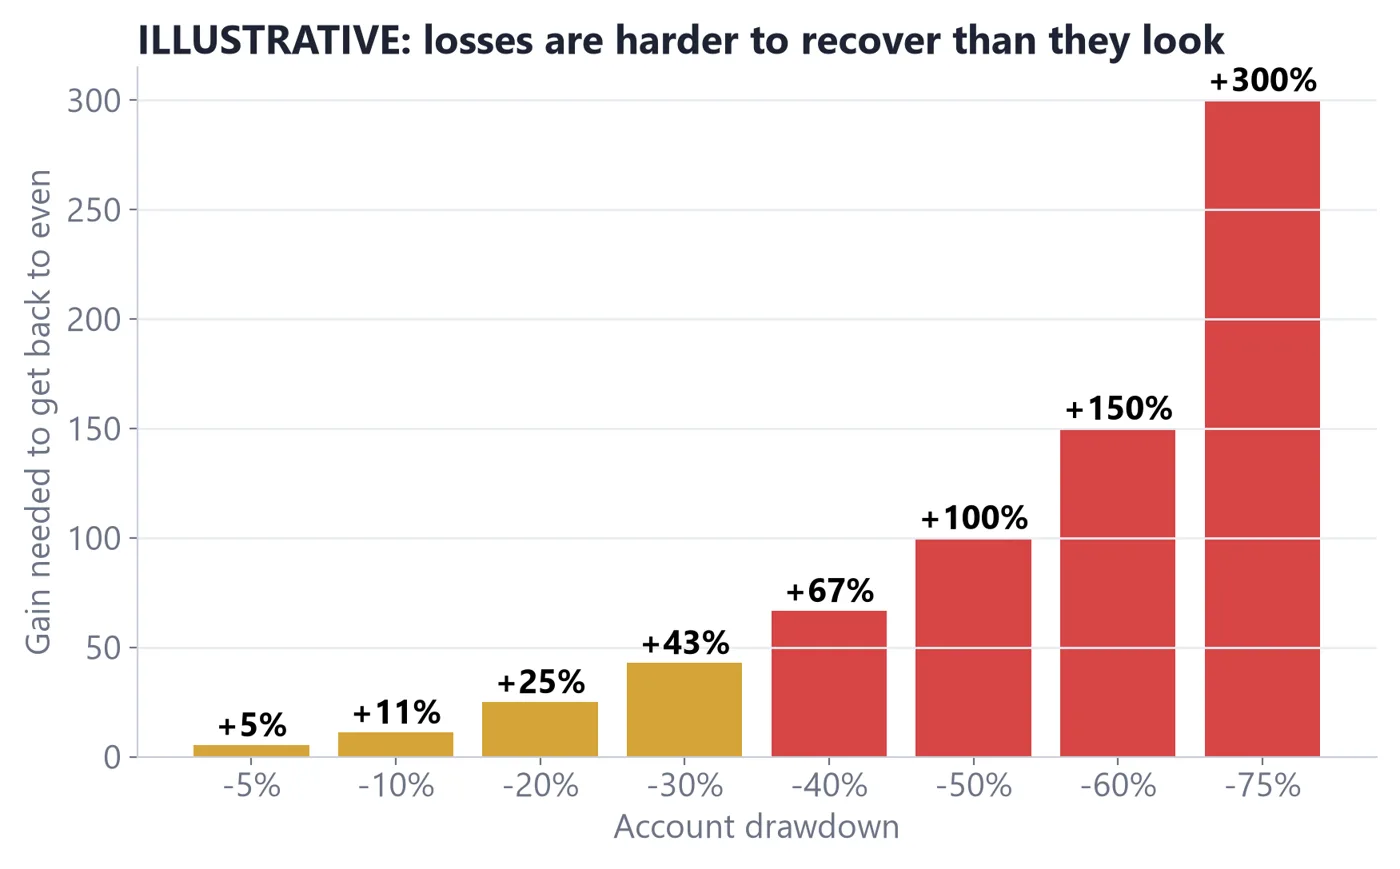
The percentage gain needed to recover from a percentage loss
How to read it
1A 10% loss needs about an 11% gain to get back to even.
2A 50% loss needs a 100% gain.
3Big leveraged losses are hard to climb out of, which is why keeping each loss small matters.
Illustrative diagram for teaching. Not real market data.
3.3 Losing more than you deposited
In futures it is possible to lose more than the money in your account. This is the point many beginners miss. If the market gaps, jumps past your stop, or trades with no buyers, your loss can exceed your balance and you may owe the broker the difference.
Hypothetical example: a $5,000 account holds 1 ES over a news event. Price gaps 150 points against the position. 150 x $50 = $7,500. The account goes to $5,000 - $7,500 = -$2,500. The trader owes $2,500, and the stop order did not help because price jumped over it. A stop is not a promise of a price. A gap is the exact moment it cannot be.
A small account with a full-size contract is the easiest way to end up here. The cure is not clever stops. It is smaller size. Tie your size to a fixed fraction of the account, such as the 1% teaching guideline from Supplement 5 (Psychology & Risk Management). With a $15,000 account, 1% is $150. A hypothetical MES stop of 30 points is 30 x $5 = $150 per contract. So the plan allows 1 MES. Compare that to 1 ES at the same stop: 30 x $50 = $1,500, which is 10% of the account and ten times the plan.
Notice that margin is not part of the sizing formula. Your margin tells you what the broker allows. Your risk rule tells you what you should allow yourself. They are different numbers, and the second one is usually much smaller.
Key takeaways
Margin is a good-faith deposit, not a loan and not a fee; day-trade margin varies by broker and can change.
Leverage magnifies gains and losses equally: 1% on ES at 5,000 is $2,500 per contract.
A gap can push losses past your account balance; a stop does not fix your fill price.
Size from your risk rule (such as 1%, a teaching guideline), not from the maximum your broker allows.
LESSON 3 · PRACTICE WORKSHEET
Lesson 3 practice: margin and leverage
Pencil and a calculator. All figures are hypothetical.
1ES is at 4,800. What is the notional value of one contract, and the leverage if initial margin is $12,000?
Show answer
4,800 x $50 = $240,000. $240,000 / $12,000 = 20 to 1.
2Account $20,000, hold 1 ES, maintenance margin $11,000. How many points down before equity hits maintenance margin?
3From the chart, what gain is needed to recover from a 50% loss? Then compute the gain needed after a 20% loss.
Show answer
100% for a 50% loss. For 20%: 1 / 0.80 = 1.25, so a 25% gain.
4On your broker's or a demo platform's margin page for MES, record initial, maintenance and day-trade margin and the date.
Show answer
Answers vary: check that you recorded all three figures with the date and that the day-trade figure is clearly lower than initial margin or is noted as not offered.
LESSON 4 · 9 MIN READ
Sessions, rollover and the calendar
🎯 You'll learn
How the nearly 24-hour session, the daily maintenance break and the regular session fit together
What roll week is and how volume shifts to the next contract
How economic releases, price limits and halts affect trading, in plain terms
4.1 The nearly 24-hour day
Equity index futures trade on an electronic platform that is open almost around the clock from Sunday evening to Friday afternoon. Stocks, by contrast, trade mainly from 9:30 am to 4:00 pm Eastern Time (ET). That daytime window is called the regular session or regular trading hours (RTH). The rest of the time is the overnight or extended session.
The most commonly quoted schedule for CME equity index futures is a one-hour daily maintenance break in the late afternoon, around 5:00 pm to 6:00 pm ET, when trading pauses. Check the CME Group website for the current times, because holidays and special days change the schedule.
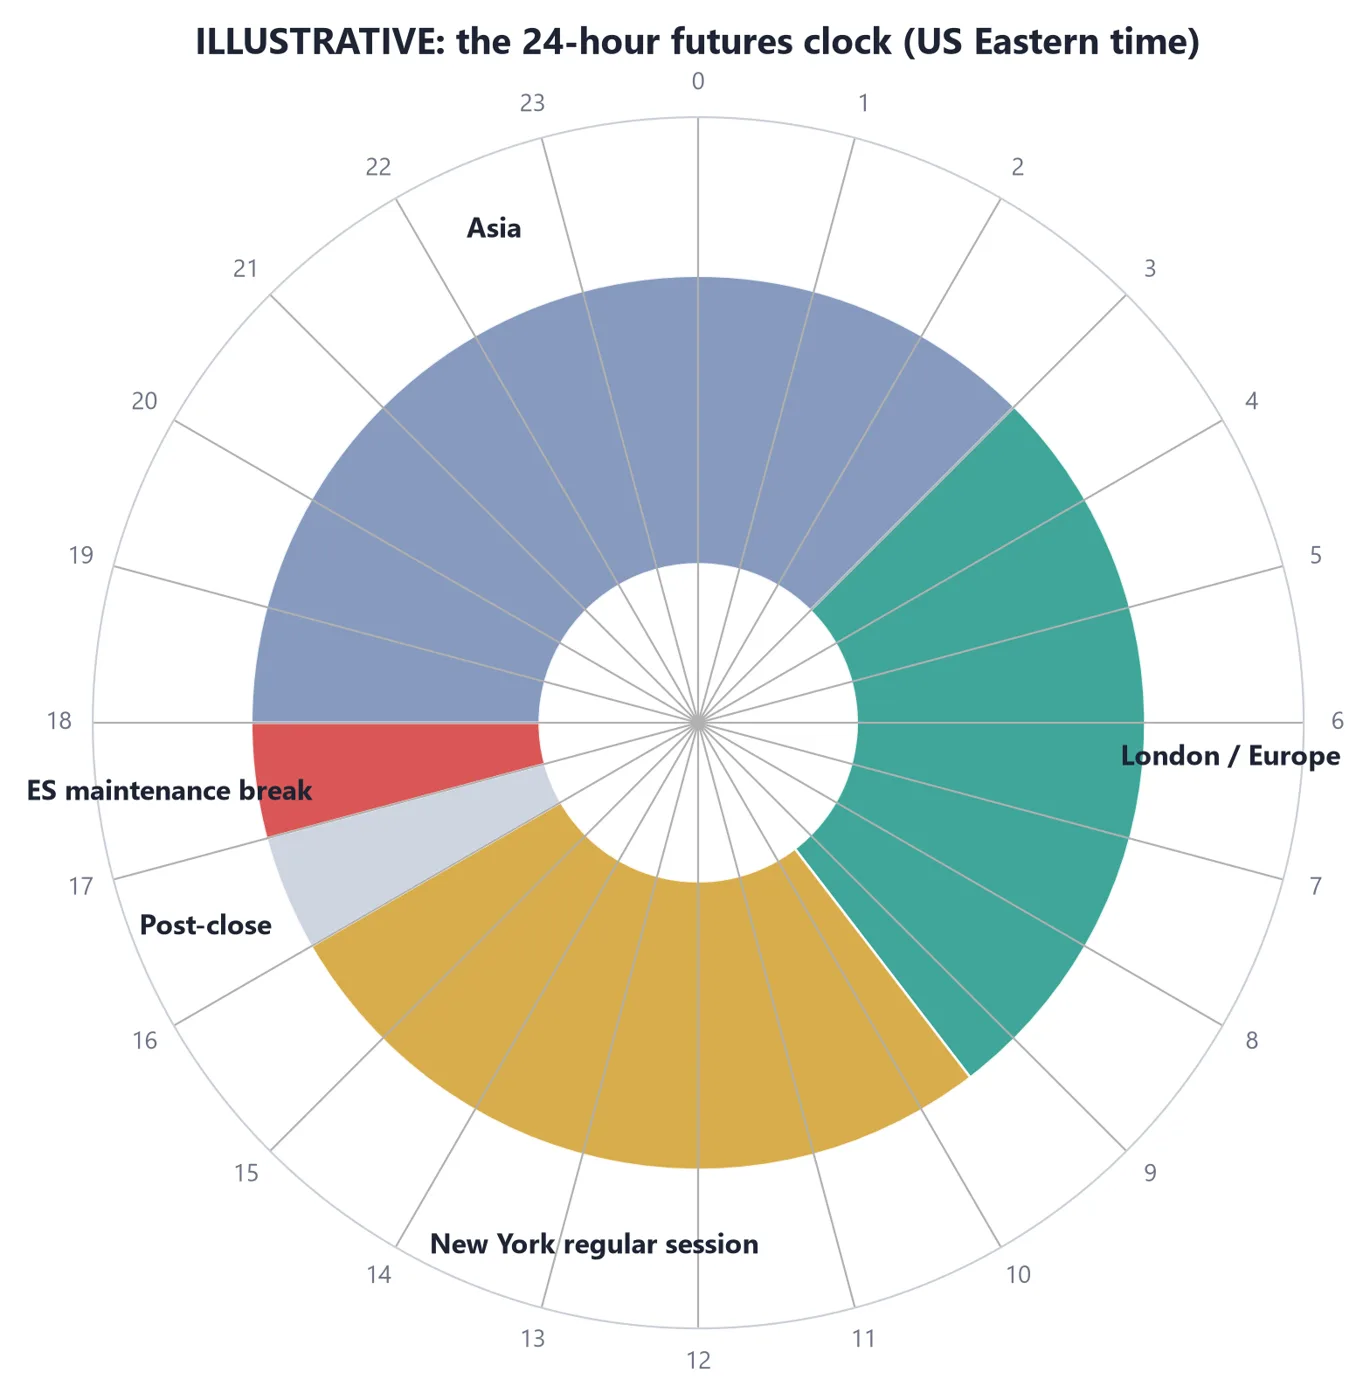
The 24-hour futures clock: Asia, London, New York and the maintenance break
How to read it
1Asia and London trade while many US traders are asleep. Volume is usually lighter then.
2The New York regular session at 9:30 am ET is when volume usually picks up most.
3The short maintenance break splits one trading day from the next.
Illustrative diagram for teaching. Not real market data.
Liquidity changes through the day. Liquidity means how easily you can buy or sell without moving the price. Overnight, fewer orders are in the market, so the gap between the best bid and ask can widen, and prices can jump on thin trading. Some traders prefer the regular session for that reason. This is a feature of the market, not a rule.
4.2 Roll week
Because each contract expires, the market must move its trading to the next month. This happens gradually. For equity index futures, many traders move from the expiring contract to the next one about a week or so before expiry. In those days, trading volume (how many contracts change hands) falls in the old contract and rises in the new one. The period is often called roll week.
The front month is the nearest expiry. As volume shifts, the next month becomes the most active one. Most traders follow the contract with the most volume, since that is where the tightest spreads and easiest fills are. Check the volume of both contracts in your platform before you decide.
To roll a position you sell the old contract and buy the new one, or the reverse for a short. The two prices are not identical. The difference is the calendar spread. Hypothetical example: you are long 1 ESZ6 and ESZ6 trades at 5,000.00 while ESH7 trades at 5,030.00. You close ESZ6 at 5,000.00 and buy ESH7 at 5,030.00. Your chart now shows a 30-point jump that is not a market move. It is the difference between two contracts. Continuous charts such as ES1! handle this by stitching, which is why they can show gaps at the roll.
Hypothetical example (skipped roll): you hold 1 CL into the last days before expiry. Your plan was to close the trade, but the position has a profit and you do not want to exit. The broker's rule says positions must be closed or rolled by a set time or they will be liquidated. You decide to skip the extra hold, close it and re-enter in the next month only if the setup is still valid. Following the broker's deadline over your wish to keep a winner is the plan working.
4.3 The calendar, limits and halts
Scheduled economic releases can move futures sharply. In the United States, many traders mark the 8:30 am ET reports such as the monthly jobs report (usually the first Friday of the month) and the consumer price index (CPI), and the Federal Reserve's interest-rate announcements, usually at 2:00 pm ET. Right before and after a release, spreads can widen and price can move fast in both directions. Some traders reduce size or stay out around them. That is a choice, not a rule.
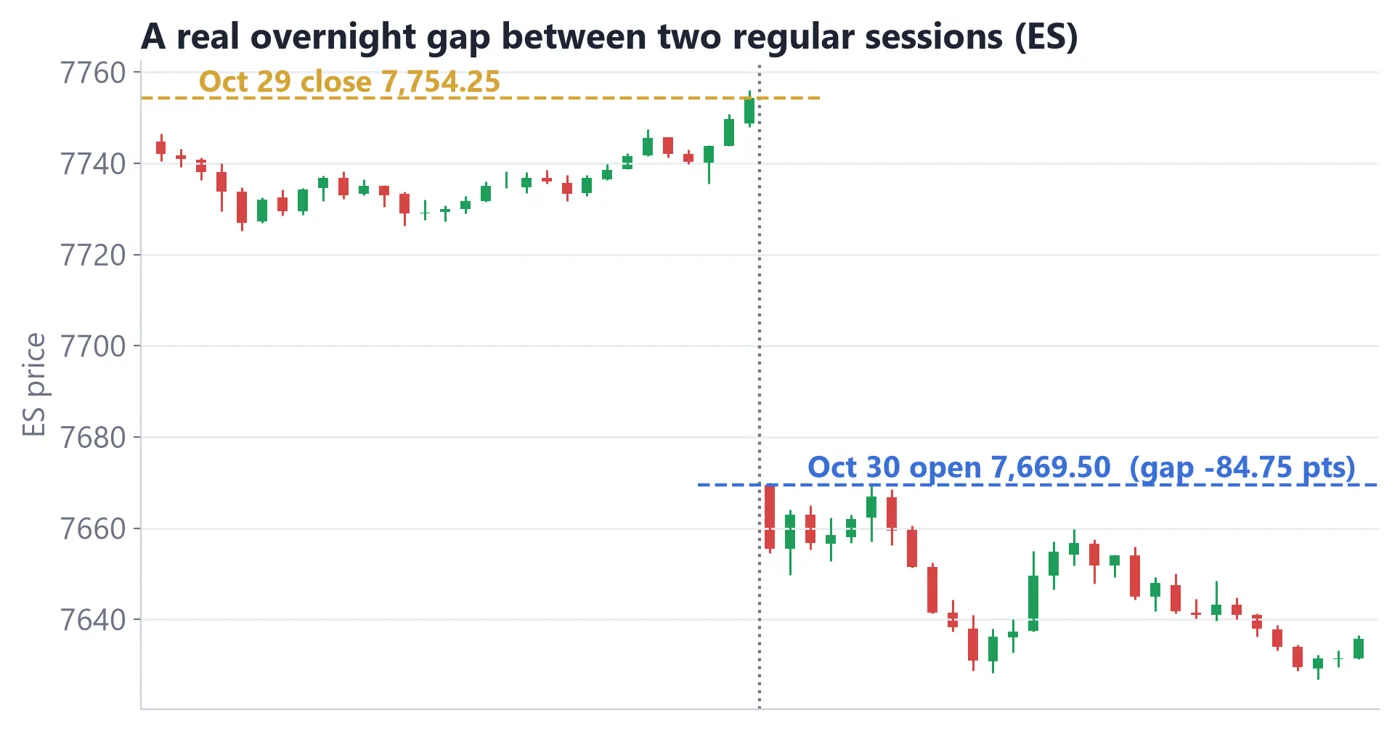
A real overnight gap on ES: the prior close and the next open
How to read it
1The gap is the empty space between the prior close and the new open.
2Futures can gap after news released during the overnight session.
3A stop order sitting inside a gap cannot fill inside it.
Real ES futures data (Yahoo Finance ES=F, 5-minute bars, regular session 9:30 AM–4:00 PM ET). Volume at price is approximated by spreading each 5-minute bar's volume across the prices it traded through.
Exchanges also put brakes on extreme moves. A price limit is a boundary, set relative to the prior day's settlement price, beyond which the exchange does not allow trades. In plain terms: when price touches the limit, trading continues only at or inside it, and a halt pauses trading for a short time. Equity index futures also follow market-wide circuit breakers linked to big drops in the S&P 500. The exact levels and rules change, so read the exchange's current rules.
What does this mean for you? If a market is limit-locked or halted, you may not be able to exit at all until trading resumes. Your loss can continue to grow while you are locked in. That is another reason to size positions small.
Key takeaways
Futures trade nearly 24 hours with a short daily maintenance break; check CME for current times.
The regular session (9:30 am to 4:00 pm ET) is usually the busiest; overnight liquidity is thinner.
Around roll week, volume moves to the next contract; follow the more active one and watch your broker's deadline.
Economic releases, price limits and halts can widen spreads or stop trading; plan size and timing around them.
LESSON 4 · PRACTICE WORKSHEET
Lesson 4 practice: sessions and the calendar
A free TradingView chart of ES with extended hours on, and the CME website.
1On the clock, mark the New York regular session and the daily maintenance break. Write the times.
Show answer
Answers vary: check that you marked the regular session as 9:30 am to 4:00 pm ET and the one-hour break around 5:00 to 6:00 pm ET, confirmed against the CME site.
2Find the gap on the chart. Write the prior close, the next open and the size in points.
Show answer
Answers vary: check that gap size = next open minus prior close, and that you read both prices from the chart.
3Hypothetical example: you are short 1 ESZ6 at 5,100.00 and roll to ESH7 at 5,128.00 (you buy back ESZ6 at 5,100.00 and sell ESH7 at 5,128.00). What is the calendar spread in points and dollars?
Show answer
28 points. 28 x $50 = $1,400 notional difference; this is the price gap between contracts, not a profit or loss on the move.
4On your own live chart of ES, compare the volume of the front-month contract and the next contract today. Which one is more active?
Show answer
Answers vary: check that you compared today's volume numbers for both contracts and named the one with higher volume.
LESSON 5 · 10 MIN READ
Prop-firm evaluations explained
🎯 You'll learn
How evaluations and funded accounts generally work, including targets, loss limits, fees and payouts
The most common reasons people fail an evaluation
How to read the rules before you pay anything
5.1 What an evaluation is
A proprietary trading firm (prop firm) is a company that lets people trade its rules-based accounts. In the retail futures world, the usual model is an evaluation (sometimes called a challenge or combine). You pay a fee. You trade a simulated account under a set of rules. If you meet the goals and follow every rule, you may be offered a funded account, which is a trading account on which you may earn a share of the profits.
This lesson is strictly educational. It does not name, rank or recommend any firm. Rules differ by firm, and they change often, so everything below is a general description, not a promise about any particular product. Also, most participants do not pass an evaluation, and many who do pass lose the funded account later. Treat the fee as money you may not get back.
The money in an evaluation is often simulated. The fee is real. Your results on a simulated account may also differ from live trading, because simulated fills can be better than real ones.
Common rule
What it generally means
Profit target
The gain you must reach to pass, for example $3,000 on a $50,000 account (hypothetical).
Daily loss limit
The most you can lose in one day before the account is stopped or failed.
Trailing drawdown
A loss limit that follows your highest balance upwards. It is the line you must stay above.
Consistency rule
A cap on how much of your total profit can come from one day.
Minimum trading days
A required number of days on which you traded.
Fees
An entry fee, sometimes monthly fees, reset fees and activation fees.
Payout rules
The profit split, the minimum to withdraw, and how often you can withdraw.
5.2 How the numbers work
Take a hypothetical $50,000 evaluation with a $3,000 profit target, a $2,000 trailing drawdown and a $1,000 daily loss limit. These numbers are made up for teaching.
Hypothetical example, trailing drawdown: you start at $50,000, so your floor is $50,000 - $2,000 = $48,000. You trade well and the balance rises to $51,000. The trailing floor rises with it to $51,000 - $2,000 = $49,000. Later the balance falls back to $49,000 and the account is breached, even though it is still $1,000 above where you began. In many programs the trail follows your highest equity including open trades, so a trade that was up $800 and gave it back can still move the floor. Always check whether the trail uses intraday equity or end-of-day balance.
Hypothetical example, consistency rule: suppose the rule is that no single day may be more than 30% of total profit. You reach $3,000 profit, but one day made $1,500. $1,500 / $3,000 = 50%, so you do not pass yet. You would need more profit on other days. If total profit becomes $5,000, then $1,500 / $5,000 = 30%, which meets the limit.
Hypothetical example, fees: an entry fee of $150 and two resets at $100 each totals $150 + $200 = $350 before you have earned anything. If a payout split is 90/10 and you withdraw $2,000 of profit, you receive 90% x $2,000 = $1,800. Whether fees ever pay back depends entirely on passing and surviving, and you cannot know that in advance.
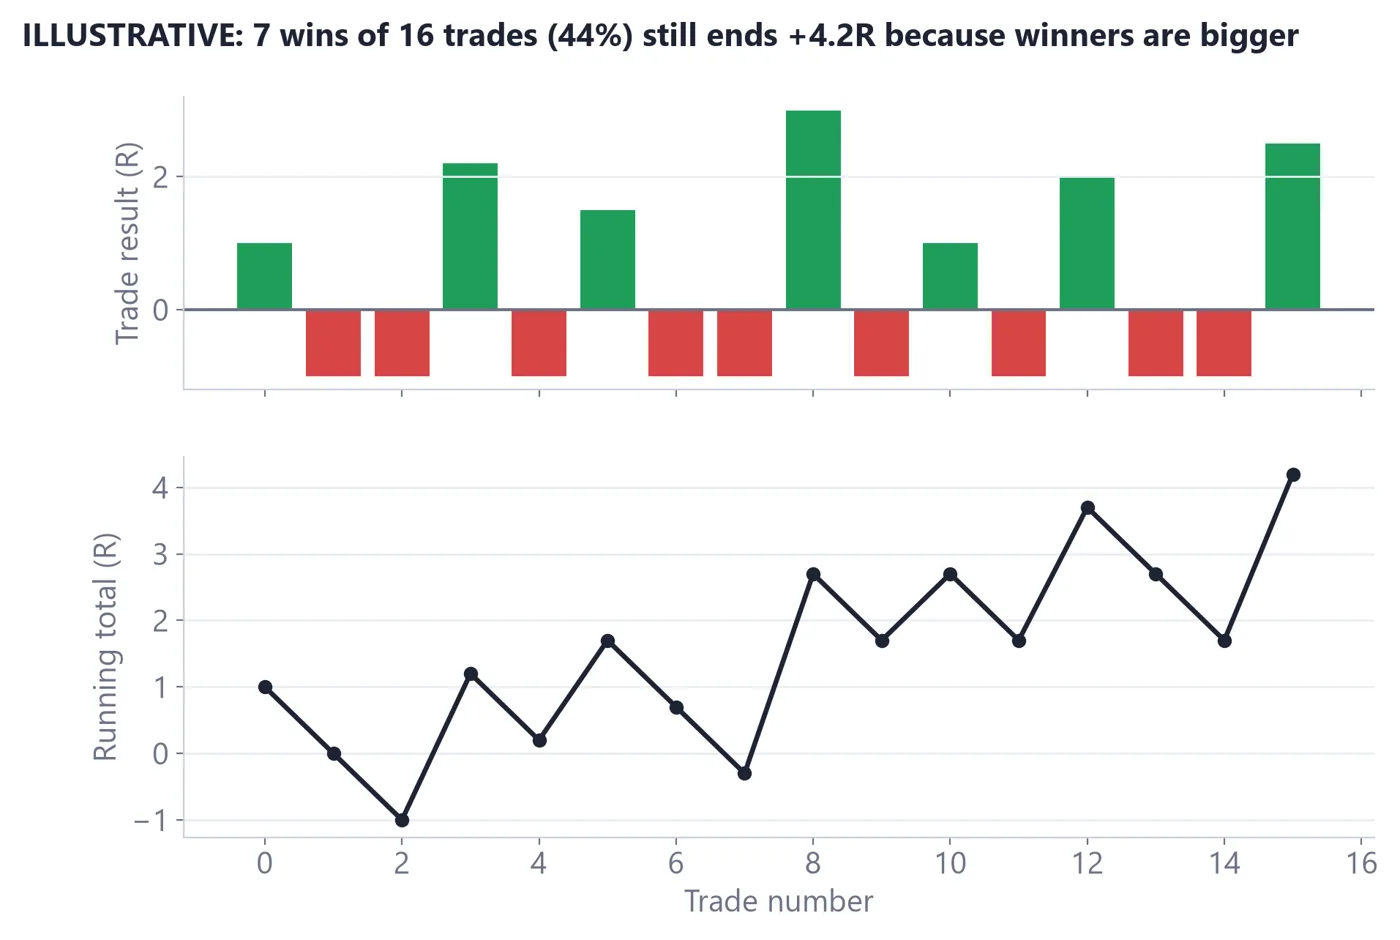
Illustrative: trades measured in R and the equity curve they produce
How to read it
1A run of small losses is normal even in an account that finishes higher.
2With a $2,000 trailing drawdown, a few oversized losses can end the evaluation quickly.
3Small, consistent R per trade is easier to fit inside daily and trailing limits.
Illustrative diagram for teaching. Not real market data.
5.3 Why people fail, and how to read the rules
The common causes are not mysterious. People oversize to hit the target quickly, so a normal losing streak breaks the drawdown. They trade after a loss to win it back. They misunderstand the trailing rule and treat it as a fixed floor. They break a small rule they never read, such as a time restriction or a limit on contracts. And they feel the fee pressure, which pushes them to take trades they would otherwise skip.
A better route is to read the rules like a contract before paying. Look for: whether the drawdown is trailing or fixed and when it stops trailing; whether it counts open profit; the daily loss limit and whether it is a pause or a fail; the maximum contracts allowed; restrictions around news events and holding overnight; the consistency rule and how it is calculated; fees for resets and monthly charges; payout minimums, schedule and split; and what happens to your funded account if rules change.
Hypothetical example (skipped): a trader reads a program and finds that the trailing drawdown counts open profit, the daily limit fails the account (it does not just pause it), and the account is only $2,000 of room on a $50,000 balance. The trader's tested plan risks about $400 per trade on ES. Two losing trades in a row would use 40% of the drawdown. The trader decides the structure does not fit their method and does not pay. Walking away is a valid result of reading the rules.
Finally, remember that a prop firm account is a business arrangement, not a source of income you are owed. Treat any marketing claim, including about pass rates, payouts or time to pass, with caution. Ask for the written rules, and keep a copy dated the day you read them, since rules can change.
Key takeaways
An evaluation is a paid test with a profit target and limits such as a daily loss limit and a trailing drawdown.
A trailing drawdown rises with your highest balance, so the floor can sit above your starting balance.
Rules differ by firm and change often, and most participants do not pass; treat the fee as money that may be lost.
Read every rule before paying and test them against your own history; skipping a program that does not fit is a valid choice.
LESSON 5 · PRACTICE WORKSHEET
Lesson 5 practice: reading evaluation rules
Pencil and a calculator. All numbers are hypothetical and do not describe any real firm.
1Hypothetical: $50,000 account, $2,500 trailing drawdown, balance peaks at $52,400. What is the floor?
Show answer
$52,400 - $2,500 = $49,900.
2Hypothetical: consistency rule is 40% of total profit. Total profit is $2,500 and your best day was $1,200. Does it pass?
Show answer
$1,200 / $2,500 = 48%, which is above 40%, so it does not pass yet. The best day may be at most $1,000.
3On the chart, find the longest run of consecutive losses. If each loss was $300, how much would that run cost, and would it fit inside a $2,000 trailing drawdown?
Show answer
Answers vary: check that cost = number of losses x $300 and that you compared it with $2,000 (for example, 4 losses = $1,200, which fits).
4On your own live or demo chart history, find your worst day in dollars. Would it have broken a $1,000 daily loss limit?
Show answer
Answers vary: check that you used the worst realised daily total and compared it with $1,000.
LESSON 6 · 10 MIN READ
A three-layer study framework: Where, Why, When
🎯 You'll learn
The three layers of the framework and the question each answers
How to score a set-up on a simple scorecard
Why a clear skip rule matters as much as an entry rule
5.1 Three layers, three questions
When you combine several tools, the screen gets crowded. A framework keeps you organised. This one has three layers. Each layer asks one question, and you need an answer to all three before a set-up is even worth studying.
Layer
Question
Tools from this series
Where
Is price at a level that I marked in advance?
Prior-day value area and POC (Guides 1 and 2), VWAP, anchored VWAP, prior highs and lows
Why
What is the context that makes this level interesting today?
Day type, open relative to value, VWAP slope, where the liquidity sits
When
What specific evidence is showing now that I defined in advance?
Footprint patterns from Guide 3: absorption, exhaustion, stacked imbalances, delta
The layers go in this order on purpose. Location comes first because a pattern in the middle of nowhere tells you little. Context comes second. The footprint trigger comes last because it is the most detailed, and the easiest to over-read.
The same framework works on any market and any timeframe. The only requirement is that each layer has a definition you wrote down earlier. If you cannot say what would make a layer score 0, 1 or 2, the layer is too vague to be useful and you should tighten it before using it.
5.2 A sample scorecard (illustrative)
A scorecard turns the layers into a quick check. The one below is an illustrative example of the idea. It is not a tested system, and its numbers are not recommendations. Build your own, and test it on a demo account before relying on it.
Layer
0 points
1 point
2 points
Where
No marked level nearby
Near a level, but only one reason
At a level that several of your tools agree on
Why
Context argues against the idea
Context is neutral
Context supports the idea
When
No footprint evidence
Weak or partial evidence
Clear evidence you defined in advance
Three gates sit on top of the scorecard in this example. Gate 1: every layer must score at least 1. Gate 2: the total must be at least 5 out of 6. Gate 3: the distance to the first target must be at least 2 times the distance to the stop. If any gate fails, the answer is to skip.
Gate 3 uses the idea of 'R'. One R is the amount you risk on a trade, measured by the stop distance. If your stop is 10 ticks away and your first target is 30 ticks away, the reward is 3R. On ES, 1 point is $50 and 1 tick (0.25 points) is $12.50, so a 10-tick stop is $125 of risk per contract. Lesson 8 uses this arithmetic.
Three points on the scorecard itself. First, it is deliberately small so you can complete it in under a minute. Second, the 5-out-of-6 threshold is an example. You may choose a different one, but choose it before you start. Third, the scorecard says nothing about outcomes; a high score does not make a trade win. It only measures whether your own conditions were met.
5.3 Seeing Where and Why on a real day
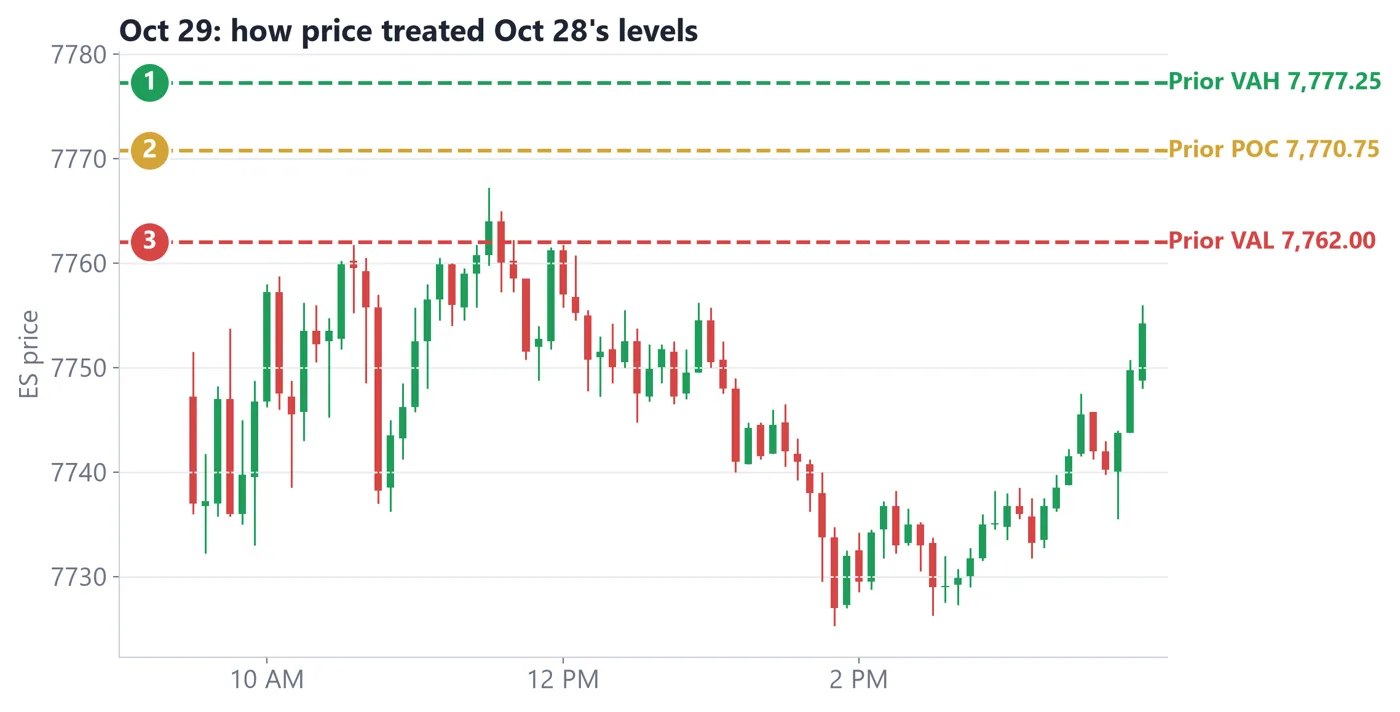
Oct 29 candles against the Oct 28 POC, VAH and VAL (real ES data)
How to read it
1Reference: Oct 28 POC 7,770.75, VAL 7,762.00, VAH 7,777.25.
2Oct 29 opened below the prior VAL, poked back above it for about 15 minutes, then fell to 7,725.
3This chart can illustrate the Where and Why layers only. We do not have tick data for this day, so there is no When layer here.
Real ES futures data (Yahoo Finance ES=F, 5-minute bars, regular session 9:30 AM–4:00 PM ET). Volume at price is approximated by spreading each 5-minute bar's volume across the prices it traded through.
The chart shows how the first two layers might be filled in. Where: the prior day's VAL at 7,762.00. Why: price opened below it, so the open was outside the prior day's value. Whether you would have had a valid trade depends on the third layer, and no footprint exists for this day in our data. A framework that cannot be completed is a framework that says skip.
It also shows an important point: a plan is a set of questions, not a prediction. Having the three layers on paper before the open means you react to evidence rather than invent a story afterwards.
Key takeaways
Where, Why, When: location, context, then evidence.
A scorecard with gates makes skipping a rule rather than a mood.
1R is the amount risked; on ES a tick is $12.50 and a point is $50.
The scorecard here is illustrative, not a tested system.
LESSON 7 · 9 MIN READ
A written pre-market routine and decision flow
🎯 You'll learn
What to write down before the market opens
How to turn the framework into a decision flow
How to handle risk, including stops moved to breakeven
6.1 The pre-market page
Professionals in many fields use checklists. A trader's version is a one-page routine done before the session starts. Writing it down matters because plans made in your head change when price moves.
Note the date, the market, and any scheduled news times in your time zone.
Write yesterday's value area (VAL, POC, VAH) and the prior high and low.
Note where the market is trading relative to those levels and relative to overnight highs and lows.
Write your Where levels for today, and one sentence of Why for each.
Write what footprint evidence you would need to see (the When) and what would make you skip.
Write your maximum risk per trade in dollars, and the maximum loss for the day at which you stop.
Step 6 is about discipline. Decide the loss limit while calm. If you reach it, you stop for the day. Having a number written down makes that easier.
Keep the page short. If it takes more than ten minutes, you will skip it on busy mornings. A single sheet with a few boxes to fill in is enough. Many traders print a template and fill it by hand, because writing slows you down in a useful way.
6.2 The decision flow
Decision flow (illustrative)
11. Is price at a level I wrote down? If no, wait.
22. Does today's context fit the idea (Why score 1 or more)? If no, skip.
33. Is there footprint evidence that I defined in advance (When score 1 or more)? If no, wait.
44. Is the scorecard total at least 5 of 6? If no, skip.
55. Is the first target at least 2x the stop distance? If no, skip.
66. Is the dollar risk within my written limit? If no, reduce size or skip.
77. Place the order with the stop, then follow the plan. Log the result.
Each step is a gate. Most of the time the flow ends in 'wait' or 'skip'. That is normal and intended. Many beginners feel they must trade every session. A written flow makes 'no trade today' a legitimate outcome.
To make the flow your own, change the questions to match your levels and tools, but keep the structure: a series of yes/no gates with a default of 'wait'. If you notice that you override the flow often, that is useful information. Either the flow is wrong, or you are not following it. Both are worth knowing, and a written record lets you find out which.
6.3 Managing the trade after entry
Once in a trade, the plan should already say what you do next. A common idea is to move the stop to breakeven (your entry price) after price has moved in your favour. Moving a stop to breakeven reduces risk but does not remove it. Price can gap through a stop, and fills can be worse than the stop price (slippage). Commissions and fees also apply. So even a breakeven stop can finish with a small loss.
Another cost of tight breakeven stops is that normal noise can stop you out before the idea has had time to play out. Whether to use one is a choice, and you should test the effect on a demo account first.
At the end of the day, add a short review: What did I plan? What did I do? What did I skip? Did I follow the gates? Reviewing process, not profit and loss, is how the routine improves.
Key takeaways
A written pre-market page fixes levels, context, evidence and risk in advance.
A decision flow turns the framework into gates; the default is wait or skip.
Breakeven stops reduce risk but do not remove it.
Review process, not just profit and loss.
LESSON 8 · 8 MIN READ
Platforms and data you need
🎯 You'll learn
The kinds of tools each guide in this series needs
Why data costs and quality matter
How to compare options without relying on endorsements
7.1 What you need for each guide
This lesson is dated as of November 2026. Prices, plans and features change often, so verify current details yourself before you pay for anything. The tools named are examples only. They are not endorsements.
Need
What it requires
Examples
Candlesticks, VWAP, volume profile (Guides 1 and 2, and Guide 4 Lessons 1 and 2)
A charting platform with futures data and volume tools
TradingView (free plans have limits), Sierra Chart, NinjaTrader
Footprint, delta, imbalance (Guide 3)
A platform with bid/ask tick data and a footprint chart
Examples include Sierra Chart, ATAS, NinjaTrader with Order Flow+, and TradingView's footprint chart on some paid plans
Real-time CME data
An exchange data subscription, often with a fee, with different fees for non-professional and professional users
Billed through your platform or broker
Practice
A simulated (demo) account with no real money
Offered by most platforms and brokers
A quick note on the Obtainable tools: TradingView's free tier offers delayed or limited data for futures in some cases, and exchange data fees are separate from the platform subscription. When a platform lists a low monthly price, check whether CME data is included, because it often is not. Add the data fee to the platform fee to find the real cost.
7.2 Data quality and costs
Real-time data and historical tick data are different things. To study footprint patterns afterwards, you need tick history stored in your platform. Some platforms store it for you; others only store it while the chart is open. Check this before you rely on a back-test or a review.
Delayed data is cheaper or free but not suitable for live decisions. A 10-minute delay in a footprint is not only late, it can mislead you about what is happening now. Another cost is your own time: a platform with many features takes a while to learn, and you are more likely to over-trade with an unfamiliar tool.
A sensible approach is to start free (a TradingView chart of ES1! with volume profile and VWAP covers Guides 1, 2 and half of this one), practise on demo, and only pay for footprint data when you have a specific question you cannot answer without it. Keep a note of what you are paying each month and what it has taught you.
Another point is how you will review your work. A platform that lets you replay a day tick by tick, or that exports your trade log, makes weekly review much easier. Ask whether the tool can replay footprint data from past days. Practising on past days, with the answer hidden, is one of the cheapest ways to learn.
7.3 Disclosure
White Feather Finance does not currently include affiliate links in these guides. If any link is ever added that pays us a commission, we will say so next to the link. Nothing in this series is an endorsement of a product, broker or data vendor. Choose tools on their features, costs and fit for you, and compare more than one.
One more point on risk: trading futures involves substantial risk of loss and is not suitable for everyone. Using a demo account first costs nothing but time, and is the safest way to find out whether a tool and an idea suit you.
Finally, keep a simple record of what each tool costs and what you used it for each month. If a paid feature has not helped you answer a question in three months, cancel it. Spending less while you learn is a form of risk control, and it leaves more of your capital for the trading itself.
Key takeaways
Check current details; this lesson is dated November 2026.
Footprint needs bid/ask tick data and often a paid plan plus exchange fees.
Start with free charts and a demo account.
Any affiliate link would be disclosed beside it.
LESSON 9 · 12 MIN READ
Case studies: three hypothetical walk-throughs
🎯 You'll learn
How to apply the Where, Why, When framework step by step
How to do the ticks, points and dollars arithmetic
What a loss and a skip look like when the rules are followed
8.1 Read this first
All three cases below are hypothetical. The prices, levels and footprint numbers are invented to practise the process. They are not real trades, not real results and not recommendations. Real trading involves substantial risk of loss, and results vary. The cases use the same scorecard and gates as Lesson 5 (every layer at least 1, total at least 5 of 6, target at least 2x the stop).
Arithmetic reminder for ES: 1 point = $50 and 1 tick (0.25 points) = $12.50, so 1 point = 4 ticks. Dollar figures are per contract and ignore commissions.
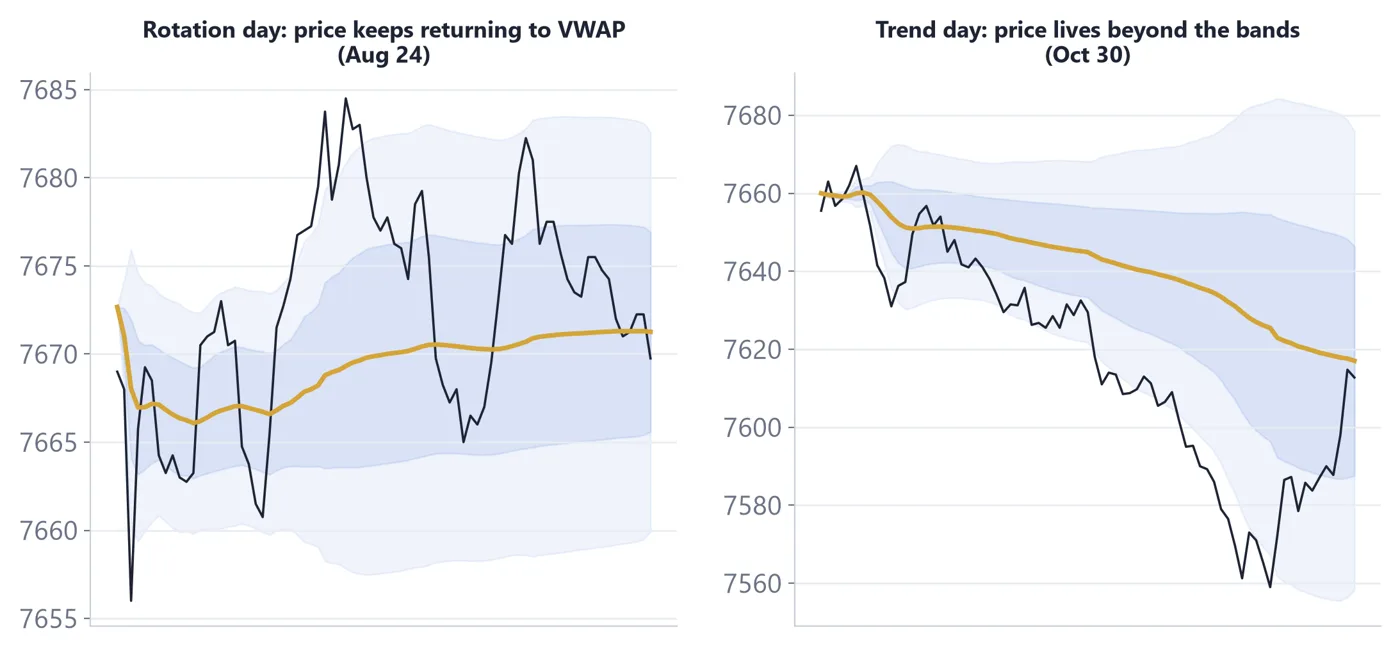
Real context: reversion vs trend days (two real days)
How to read it
1Reversion day: trade returns to VWAP.
2Trend day: price stays on one side. Cases 1 and 2 are set on days like the first; Case 3 is set on a day like the second.
Real ES futures data (Yahoo Finance ES=F, 5-minute bars, regular session 9:30 AM–4:00 PM ET). Volume at price is approximated by spreading each 5-minute bar's volume across the prices it traded through.
8.2 Case 1 (hypothetical): a win
Hypothetical example. Where: the prior day's VAL is 7,700.00 (invented). Price drops to test it from above at the open. Why: the market opened inside the prior value area, and VWAP is flat, which looks like a balanced day. When: heavy sell volume prints at 7,699.00 to 7,699.50 but price cannot make a lower low, which is consistent with absorption (heavy volume, no progress). The next bar turns delta positive.
Scorecard: Where 2, Why 1, When 2 = 5. All layers are at least 1, and the total is 5. Entry: buy at 7,701.00 after the confirmation bar. Stop: 7,698.50, which is 0.50 points below the absorbed low at 7,699.00. Stop distance: 7,701.00 - 7,698.50 = 2.50 points = 10 ticks = $125 risk. First target: the flat VWAP at 7,708.50. Target distance: 7.50 points = 30 ticks = $375. Reward to risk: 30 / 10 = 3.0R, so Gate 3 passes.
Result in this invented story: price reaches 7,708.50 and the trade is closed there. Gross gain: +7.50 points = +$375 = +3.0R, before commissions. One winning example proves nothing about the method. It only shows the arithmetic.
8.3 Case 2 (hypothetical): a loss that followed the rules
Hypothetical example. Where: the prior day's VAH is 7,725.00 (invented). Why: price opened inside value; the day looks balanced. When: price pushes to 7,725.00 and the footprint below shows volume drying up at the top, a thin tip, which is consistent with exhaustion.
ILLUSTRATIVE
Hypothetical exhaustion at the prior day's VAH (invented numbers)
bid (sellers hitting) × ask (buyers lifting) · green rows = diagonal buying imbalance (ask ≥ 3× the bid one tick lower)
Thin-tip bar
7,725.00
3
×
4
7,724.75
5
×
7
7,724.50
18
×
40
7,724.25
35
×
95
7,724.00
50
×
130
7,723.75
62
×
120
Δ +223
Top rows 7,725.00 and 7,724.75 hold very few contracts; most volume traded lower in the bar. Assume the following bar fails to make a new high and its delta turns negative. Thin-tip bar: bid 173 + ask 396; delta = ask - bid = +223; busiest row 7,723.75 (182 contracts). Diagonal ask imbalances (ask at P at least 3x bid at P - 1 tick): none. Diagonal bid imbalances (bid at P at least 3x ask at P + 1 tick): none.
Illustrative diagram for teaching. Not real market data.
Scorecard: Where 2, Why 1, When 2 = 5. Entry: sell short at 7,723.50 after the follow-up bar. Stop: 7,726.00, which is 1.00 point above the 7,725.00 high, where buy stops of shorts and of breakout buyers may rest (long stops would sit below a low, not here). Stop distance: 7,726.00 - 7,723.50 = 2.50 points = 10 ticks = $125 risk. First target: 7,716.00, which is 7.50 points = 30 ticks = $375 = 3.0R. Gates 1, 2 and 3 all pass.
Result in this invented story: price pushes through the high and the stop fills one tick worse than planned, at 7,726.25 (slippage). Actual loss: 7,726.25 - 7,723.50 = 2.75 points = 11 ticks = $137.50, which is 1.1R. The rules were followed and the trade still lost. A loss like this is an expected cost of a process. The useful review question is not 'why did I lose?' but 'did I follow the gates and the risk limit?' Here the answer is yes.
8.4 Case 3 (hypothetical): a skipped trade
Hypothetical example. Price rallies on a day like the trend day above and reaches the prior day's VAH at 7,740.00 (invented). Where scores 2: a marked level. Why scores 0: price has stayed on one side of VWAP all session, and VWAP slope is steeply up, so the context argues against the idea of a reversal. When scores 1: a small ask imbalance but no clear exhaustion. Total: 2 + 0 + 1 = 3.
Gate 1 fails (Why is 0) and Gate 2 fails (3 is under 5). Gate 3 would also fail: a short at 7,742.00 with a stop at 7,744.50 risks 2.50 points = 10 ticks = $125, but the nearest target at 7,740.00 is only 2.00 points = 8 ticks = $100 away, which is 0.8R, under the 2R minimum.
The decision is to skip. What price does next does not change whether the skip followed the rules. A skipped trade that would have won is still a correct skip, and a skipped trade that would have lost is not proof of skill. Record it in your log with the three scores and move on.
Key takeaways
Case 1: +3.0R, a win ($375 on 30 ticks). Case 2: a 1.1R loss ($137.50) that followed the rules. Case 3: a skip.
1 point = $50, 1 tick = $12.50; always convert stop and target to ticks and dollars first.
Slippage and gaps can make a loss larger than planned.
Hypothetical cases show process, not performance.
Quick check answers
Lesson 1: Q1 A, Q2 B, Q3 B
Lesson 2: Q1 B, Q2 A, Q3 B
Lesson 3: Q1 B, Q2 B, Q3 A
Lesson 4: Q1 B, Q2 B, Q3 B
Lesson 5: Q1 B, Q2 B, Q3 A
Lesson 6: Q1 A, Q2 A, Q3 B
Lesson 7: Q1 A, Q2 B, Q3 B
Lesson 8: Q1 A, Q2 B, Q3 A
Lesson 9: Q1 B, Q2 A, Q3 A
Worksheet answer key
Lesson 1: Lesson 1 practice: contracts and codes
NQ (E-mini Nasdaq-100), M = June, 7 = 2027. So June 2027.
12.5 points x $50 = $625 gross, before fees.
Answers vary: check that you note Bitcoin trades 24/7 with no daily break, while ES trades nearly 24 hours with a short daily maintenance break.
Answers vary: check that the code has a root, a month letter and a year digit, and that the settlement type matches the product's contract specification on the exchange website.
Lesson 2: Lesson 2 practice: tick maths
15 / 0.25 = 60 ticks x $5.00 = $300 per contract x 2 = $600. Check: 15 x $20 x 2 = $600.
1.50 / 0.10 = 15 ticks x $10 = $150. That is more than $80, so one contract does not fit; skip or find a tighter logical stop.
8 points = 32 ticks x $1.25 = $40 per contract. $100 / $40 = 2.5, round down to 2 contracts.
Answers vary: check that ticks = points x 4, and dollars = ticks x $1.25 for MES or ticks x $0.50 for MNQ.
Lesson 3: Lesson 3 practice: margin and leverage
4,800 x $50 = $240,000. $240,000 / $12,000 = 20 to 1.
100% for a 50% loss. For 20%: 1 / 0.80 = 1.25, so a 25% gain.
Answers vary: check that you recorded all three figures with the date and that the day-trade figure is clearly lower than initial margin or is noted as not offered.
Lesson 4: Lesson 4 practice: sessions and the calendar
Answers vary: check that you marked the regular session as 9:30 am to 4:00 pm ET and the one-hour break around 5:00 to 6:00 pm ET, confirmed against the CME site.
Answers vary: check that gap size = next open minus prior close, and that you read both prices from the chart.
28 points. 28 x $50 = $1,400 notional difference; this is the price gap between contracts, not a profit or loss on the move.
Answers vary: check that you compared today's volume numbers for both contracts and named the one with higher volume.