Six short lessons to read your first futures chart (a free teaser for the 31-day book)
6 lessons~54 minBeginner6 printable worksheets
Educational only. Not financial advice. Futures trading involves substantial risk of loss and is not suitable for every investor. Past market behaviour shown here does not predict future results.
WHITE FEATHER FINANCE
Important: please read
Educational only. Not financial advice. This book teaches how traders read market data and manage risk. It does not tell you what to buy or sell.
Trading involves substantial risk of loss. Futures are leveraged and can lose more than your deposit. Options can expire worthless, and selling options can lose far more than the premium received. Only trade money you can afford to lose.
Past market behaviour does not predict future results. Charts and examples are historical or hypothetical, for illustration only. Rules of thumb quoted from trading literature are heuristics, not guarantees.
White Feather Finance is an education company, not a registered investment adviser, broker-dealer or commodity trading advisor.
How to use this book
This free mini guide is for people who have never traded or who have only looked at a chart. In six short lessons you will learn what a futures contract is and how it differs from an ETF, an option and Bitcoin, how to read a candlestick, how timeframes change what you see, how to describe a trend, how to mark support and resistance, and how volume and sessions add context.
Every lesson has a short quiz and a printable worksheet. You will use the E-mini S&P 500 (ES) and its micro (MES) as the main example, with a few notes on the Nasdaq-100 (NQ and MNQ), SPY and Bitcoin.
This is education only. It is not advice, and hypothetical examples are labelled. Trading futures and options involves substantial risk of loss. When you finish, the book Learn to Trade in 31 Days ($29) continues from here.
Before you start: None. You need a free TradingView account (or any charting site) and a pencil.
📖 ReadPlain-English explanations; every term is in the glossary.
📊 SeeEvery concept has a chart or a labelled diagram.
🛠️ DoA 5-minute "Try it" task and a 3-question quick check, plus a printable worksheet for each lesson.
🎬 WatchShort companion videos on YouTube @WFeatherFinance.
What a futures contract is and what a tick is worth
How futures differ from an ETF, an option and Bitcoin
Why leverage cuts both ways
1.1 A contract, not a company
A futures contract is a standardized agreement to buy or sell something at a set price on a set future date. For stock-index futures like the E-mini S&P 500 (ES), nobody delivers shares. The contract is settled in cash, and traders mostly close it before it expires. You are trading the price movement of the index, not owning a company.
Each contract has a fixed size. One ES point is worth $50, and the smallest price move, the tick, is 0.25 points = $12.50. The micro versions are one tenth the size, so they let you trade smaller.
Contract
Tracks
Tick size
Tick value
Point value
ES
S&P 500
0.25
$12.50
$50
MES
S&P 500 (micro)
0.25
$1.25
$5
NQ
Nasdaq-100
0.25
$5.00
$20
MNQ
Nasdaq-100 (micro)
0.25
$0.50
$2
Hypothetical example: you hold 1 MES and price rises 8 points. 8 points x $5 = $40. The same 8-point move on 1 ES = 8 x $50 = $400. In ticks: 8 points = 32 ticks; 32 x $1.25 = $40 for MES and 32 x $12.50 = $400 for ES.
1.2 Leverage and margin
Futures are leveraged. If the index is at 7,700, one ES contract controls 7,700 x $50 = $385,000 of index value, and one MES controls $38,500. You do not pay that. Your broker holds a margin deposit, which is a good-faith amount that is much smaller, and which varies by broker and by time. Margin is not the maximum you can lose. Losses can exceed what you put up, which is why sizing (see Supplement 5 (Psychology & Risk Management)) matters.
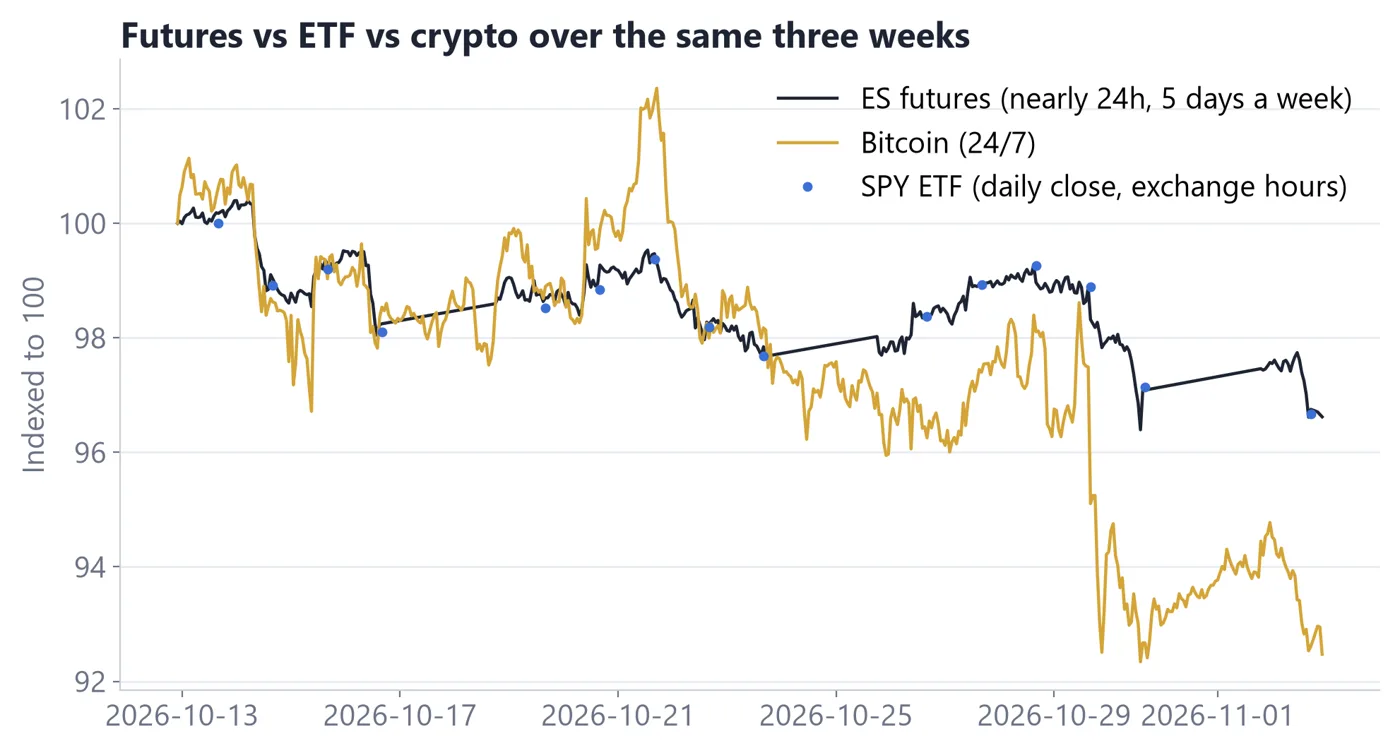
Real data: ES (futures), SPY (ETF) and BTC (crypto) on one normalised chart
How to read it
1All three are normalised to start at the same value so you can compare their moves.
2ES and SPY follow the same index but trade on different schedules and sizes.
3Bitcoin trades all day every day and moves very differently.
Real ES futures data (Yahoo Finance ES=F, 5-minute bars, regular session 9:30 AM–4:00 PM ET). Volume at price is approximated by spreading each 5-minute bar's volume across the prices it traded through.
1.3 Futures versus an ETF, an option and Bitcoin
Product
What you hold
Hours
Key idea
ES / MES futures
A leveraged contract on the S&P 500
Nearly 24 hours, Sunday to Friday
Expires quarterly; tick value fixed
SPY (ETF)
Shares of a fund that tracks the S&P 500
Regular hours plus extended hours
No expiry; you pay the full price per share
SPY option
A right (not an obligation) to buy or sell 100 shares at a strike by an expiry date
Regular hours
Buyer risk is the premium; time decay works against buyers
Bitcoin (BTC)
A digital asset
24 hours, 7 days
No exchange closing; no daily settlement
Futures expire. The quarterly index contracts use the month codes H (March), M (June), U (September) and Z (December). Traders roll from the expiring contract to the next one, usually about a week before expiry. Check the exchange calendar for exact dates.
Key takeaways
A futures contract tracks a price and has a fixed value per tick.
ES tick $12.50, NQ $5.00, MES $1.25, MNQ $0.50; one point = 4 ticks.
Futures expire and are leveraged; margin is not your maximum loss.
ETFs, options and Bitcoin are different products with different risks.
LESSON 1 · PRACTICE WORKSHEET
Lesson 1 practice: the contract
Calculator and pencil.
1Price on 1 MES rises 12 points. What is the gain? What is the same move on 1 ES?
Show answer
MES: 12 x $5 = $60. ES: 12 x $50 = $600.
2An NQ stop is 40 ticks. What is the dollar risk per NQ contract? Per MNQ?
Show answer
NQ: 40 x $5.00 = $200. MNQ: 40 x $0.50 = $20.
3On the chart, which of the three moved most? Which line has no gaps or closings?
Show answer
Answers vary with the chart: check that you compare the lines and note Bitcoin trades continuously.
4On your own live chart (futures, a stock or Bitcoin), find the tick size and its dollar value for your market.
Show answer
Answers vary: check that you looked up the contract specification (for example MES 0.25 = $1.25).
LESSON 2 · 9 MIN READ
Reading a candlestick
🎯 You'll learn
The four prices in every candle
How to read body and wicks
Why patterns are context, not signals
2.1 Open, high, low, close
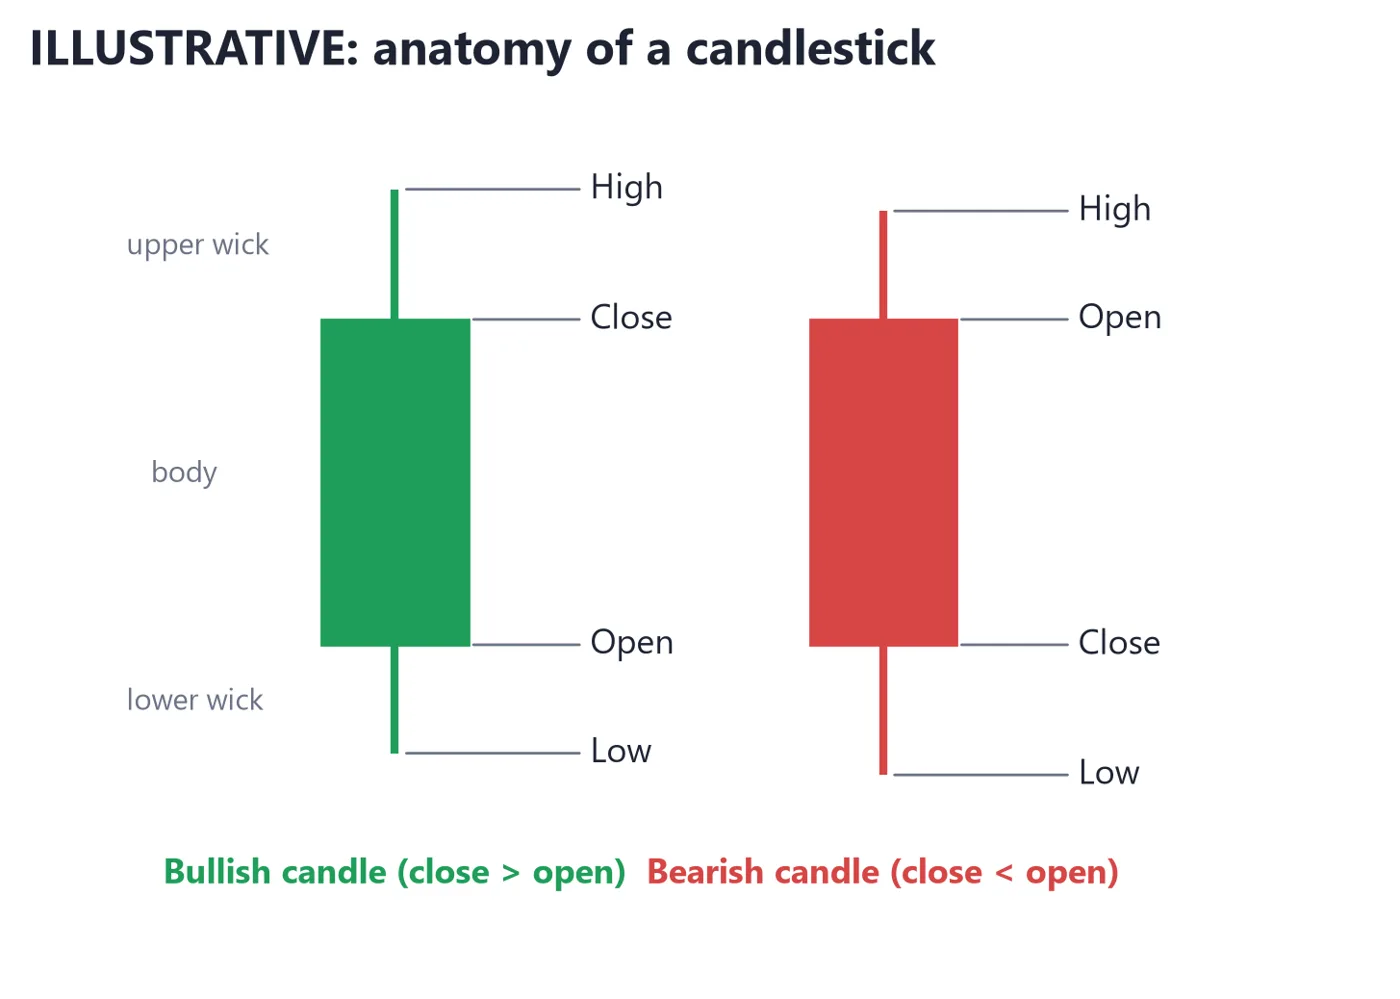
A candlestick summarizes the trading in one time period (one minute, one hour, one day) using four prices: the open, the high, the low and the close (OHLC). The thick part is the body, from open to close. The thin lines are wicks (also called shadows), reaching to the high and the low.
Illustrative: a green (up) and a red (down) candle with OHLC labelled
How to read it
1Green: the close is above the open. The body runs from open (bottom) to close (top).
2Red: the close is below the open. The body runs from open (top) to close (bottom).
3Wicks show how far price went beyond the body before coming back.
Illustrative diagram for teaching. Not real market data.
Hypothetical example on ES: open 7,700, high 7,712, low 7,696, close 7,708. The candle is up (close above open). Body = 8 points (32 ticks, $400 per ES contract). Upper wick = 7,712 - 7,708 = 4 points. Lower wick = 7,700 - 7,696 = 4 points. Total range = 16 points.
2.2 What body and wicks suggest
A big body means one side was in control for most of the period. A long wick means price went somewhere and was pushed back. It is a hint that the market tested a price and did not accept it. A small body with long wicks on both sides is a period of indecision.
Look
Often described as
Careful
Long body, tiny wicks
Strong move in one direction
It may be the end of a stretch, not the start
Long lower wick
Buyers pushed price back up
One candle is not a reversal
Long upper wick
Sellers pushed price back down
Same: look at what came before
Tiny body (doji)
Indecision, open near close
Needs context from nearby levels
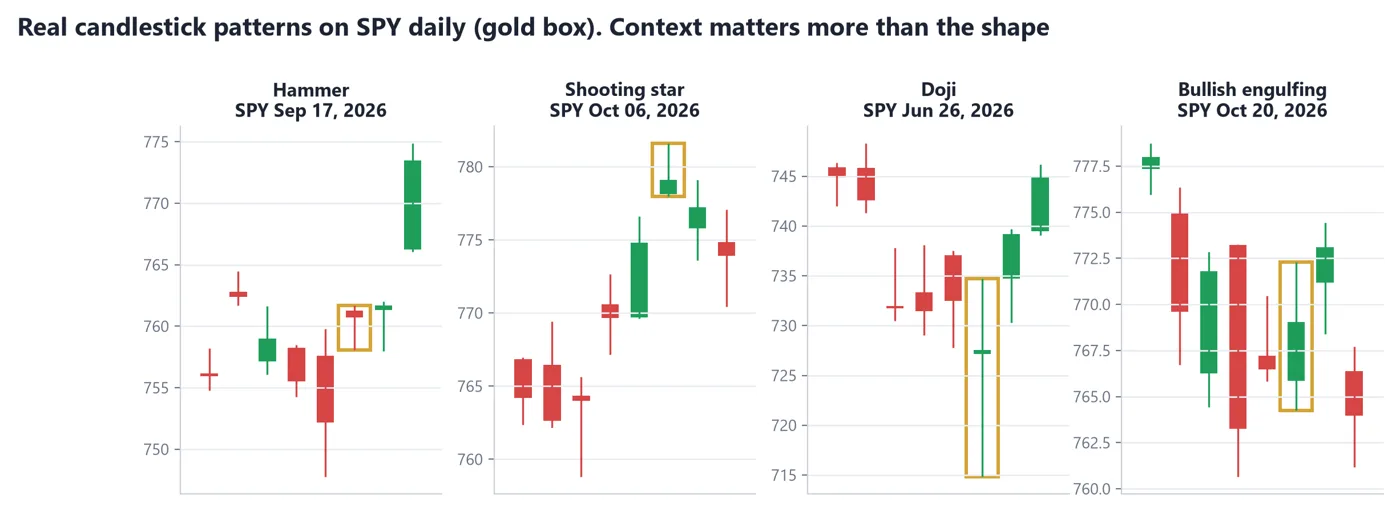
Real examples: hammer, shooting star, engulfing, doji (cropped from real ES/SPY daily bars)
How to read it
1Each example sits at a different place in a move, which is why context matters.
2Look at what happened before the pattern, not just the shape.
3These are examples, not a prediction of what comes next.
Real ES futures data (Yahoo Finance ES=F, 5-minute bars, regular session 9:30 AM–4:00 PM ET). Volume at price is approximated by spreading each 5-minute bar's volume across the prices it traded through.
2.3 Patterns are context, not signals
Candle names like hammer or engulfing describe a shape. They do not tell you the next move. The same shape can appear in the middle of a drift, where it means nothing. It means more when it appears at a level you already marked (see Lesson 5) and when other evidence agrees. Traders who treat a pattern as a trigger by itself often find it fails about as often as it works.
Key takeaways
Each candle holds open, high, low and close.
Body shows who controlled the period; wicks show rejected prices.
Patterns describe shapes; the location and context give them meaning.
Treat any single candle as a clue, never a trigger.
LESSON 2 · PRACTICE WORKSHEET
Lesson 2 practice: read the candles
Pencil. Use the chart without labels.
1Name the four prices of the green candle. Which price is at the top of the body?
Show answer
Open, high, low, close. The close is at the top of a green candle's body.
2A candle: open 5,000, high 5,030, low 4,990, close 4,995. Is it green or red? Body size? Upper and lower wick sizes?
3Pick one pattern. Describe what happened before it. Did the next candle confirm the idea?
Show answer
Answers vary: check that you describe context before the pattern and do not claim it was predictive.
4On your own live chart (futures, stock or Bitcoin), find a doji. Mark the nearest level above and below it.
Show answer
Answers vary: check that a small-body candle was found and levels were marked.
LESSON 3 · 8 MIN READ
Timeframes
🎯 You'll learn
How the same price move looks on different timeframes
How to pick a timeframe for your style
The top-down habit
3.1 Same market, different zoom
A timeframe is how much time each candle represents. A 5-minute chart makes a new candle every five minutes. A daily chart makes one per day. Nothing changes about the market. You are changing the zoom level. A regular ES session of 9:30 AM to 4:00 PM ET is 390 minutes, which is 78 five-minute candles but one daily candle.
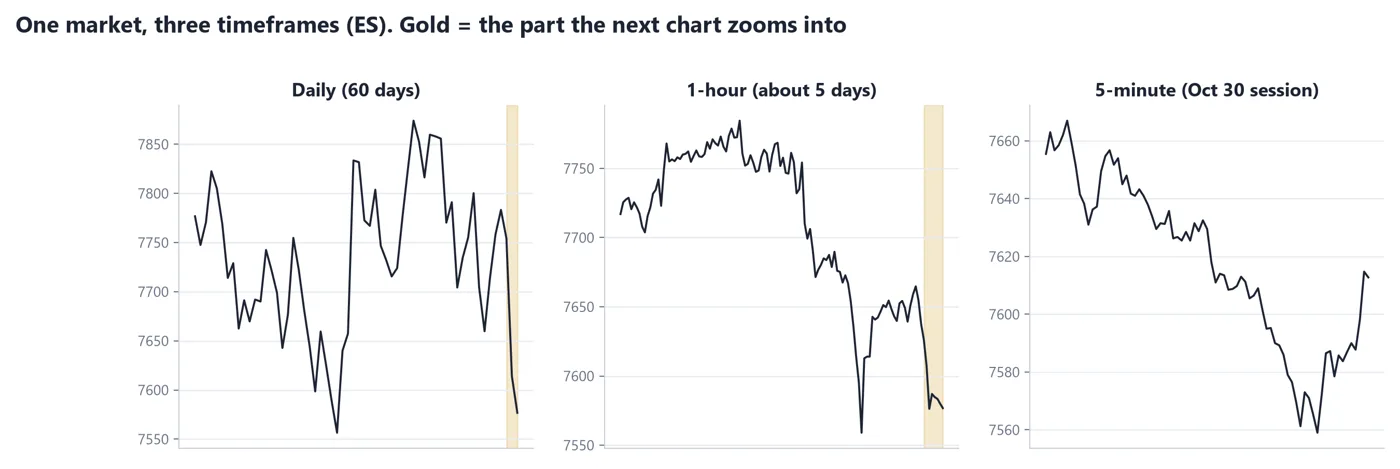
Real data: the same ES move on daily, 1-hour and 5-minute charts
How to read it
1On the daily chart the move looks like a few candles.
2On the 1-hour chart you can see how the move was built.
3On the 5-minute chart you see every pause and push, which also means more noise.
Real ES futures data (Yahoo Finance ES=F, 5-minute bars, regular session 9:30 AM–4:00 PM ET). Volume at price is approximated by spreading each 5-minute bar's volume across the prices it traded through.
Short timeframes show more detail and more noise. Long timeframes show a cleaner picture, but fewer opportunities and wider stops. A 10-point stop on a daily chart is tiny; the same distance on a 1-minute chart is large.
3.2 Pick a timeframe that fits you
Timeframe
Typical use
Trade-off
1 to 5 minutes
Day trading entries
Fast, noisy, needs attention
15 minutes to 1 hour
Day structure and swing intraday
Balanced detail and clarity
Daily
Trend and levels, swing trading
Slow, wide stops, calm
The choice also decides your risk. Your stop distance usually scales with the timeframe, and your position size should scale with your stop (see Supplement 5 (Psychology & Risk Management)). Hypothetical example: with a $100 risk budget on MES, a 20-tick stop ($25 per contract) allows 4 contracts; a 40-tick stop ($50) allows 2.
3.3 The top-down habit
Many traders look at the larger timeframe first for the trend and key levels, then step down to a smaller timeframe to time an entry. If the daily chart is in an uptrend and the 5-minute chart shows a short setup, you are trading against the bigger picture. That can still work, but it deserves a smaller expectation and a clear plan.
Key takeaways
Timeframes change zoom, not the market.
Shorter charts show more detail and more noise.
Match timeframe to stop size and size to stop.
Check the larger timeframe first, then step down.
LESSON 3 · PRACTICE WORKSHEET
Lesson 3 practice: zoom in and out
Pencil.
1Which panel shows the most noise? Which shows the cleanest trend?
Show answer
Answers vary: check the 5-minute panel is the noisiest and the daily panel the cleanest.
2The regular session is 6.5 hours. How many 15-minute candles are in it?
Show answer
6.5 x 60 = 390 minutes; 390 / 15 = 26 candles.
3MES stop 24 ticks, risk budget $90. How many contracts?
Show answer
24 x $1.25 = $30 per contract; $90 / $30 = 3 contracts.
4On your own live chart (futures, stock or Bitcoin), write the trend direction on the daily, 1-hour and 5-minute charts.
Show answer
Answers vary: check that each timeframe has a direction (up, down or sideways).
LESSON 4 · 9 MIN READ
Trend and market structure
🎯 You'll learn
How highs and lows define a trend
What a break of structure means
Why the trend is a description, not a promise
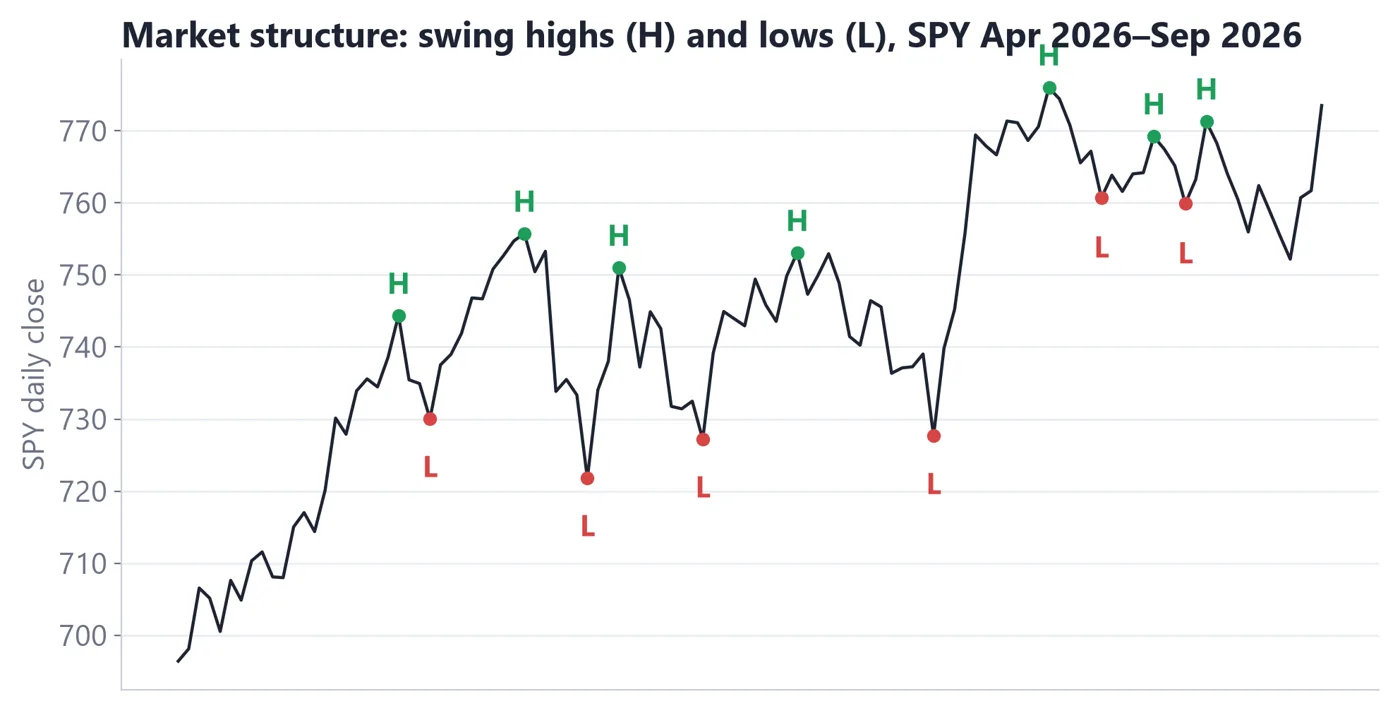
4.1 Swings and trends
Price moves in swings: a push in one direction, a pullback, then another push. A swing high is a peak with lower prices on both sides; a swing low is a valley with higher prices on both sides. An uptrend is a sequence of higher highs and higher lows. A downtrend is lower highs and lower lows. When neither holds, the market is ranging (moving sideways).
Real data: swings labelled as higher highs and higher lows, then a break of structure
How to read it
1Each higher low shows buyers stepping in at a higher price than before.
2The structure is a series of rising peaks and valleys.
3A close below the last higher low is a break of structure: the pattern has changed.
Real ES futures data (Yahoo Finance ES=F, 5-minute bars, regular session 9:30 AM–4:00 PM ET). Volume at price is approximated by spreading each 5-minute bar's volume across the prices it traded through.
Hypothetical example: ES makes a low at 7,700, a high at 7,740, a low at 7,715 and a high at 7,760. The lows are 7,700 then 7,715 (higher) and the highs 7,740 then 7,760 (higher). That is an uptrend by this definition.
4.2 Break of structure
A break of structure happens when price breaks the pattern. In the example, if price falls below 7,715, the last higher low, the series of higher lows is broken. That does not mean a downtrend has started. It is a warning that the earlier pattern may be changing, so traders review the plan, tighten expectations or stand aside.
Many traders use the last swing low in an uptrend as the place where the idea is wrong, so it is a natural spot for an invalidation level (see Supplement 5 (Psychology & Risk Management)). Structure gives your stop a reason.
Pattern
Highs
Lows
Description
Uptrend
Higher
Higher
Buyers in control so far
Downtrend
Lower
Lower
Sellers in control so far
Range
Similar
Similar
Neither side in control
4.3 Trends end
Every trend ends. The definition only describes what has happened, it does not forecast. Trends can also be defined differently by timeframe: a 5-minute uptrend can be a pullback inside a daily downtrend. Always note which timeframe you are describing.
Key takeaways
Trends are sequences of swings: higher highs and lows, or lower highs and lows.
A break of structure is a warning, not an automatic reversal.
The last swing gives a logical place for a stop.
Name the timeframe when you name the trend.
LESSON 4 · PRACTICE WORKSHEET
Lesson 4 practice: label the swings
Pencil and ruler.
1Mark each swing high (H) and swing low (L). Circle the break of structure.
Show answer
Answers vary: check that highs and lows alternate and the break is the move below the last higher low.
2Lows: 4,950, 4,980, 5,010, 4,990. Highs: 5,000, 5,040, 5,070. Where was the break of structure?
Show answer
The last low, 4,990, is below the previous low of 5,010, so the higher-low sequence broke at 4,990 (below 5,010).
3In the previous task, how many points was the break below the prior higher low? What is that in ES ticks and dollars (1 contract)?
4On your own live chart (futures, stock or Bitcoin), label the last 4 swings and describe the trend.
Show answer
Answers vary: check that highs and lows are compared in order.
LESSON 5 · 9 MIN READ
Support and resistance
🎯 You'll learn
What support and resistance are
Why levels become zones and sometimes swap roles
How to use a level as a plan rather than a prediction
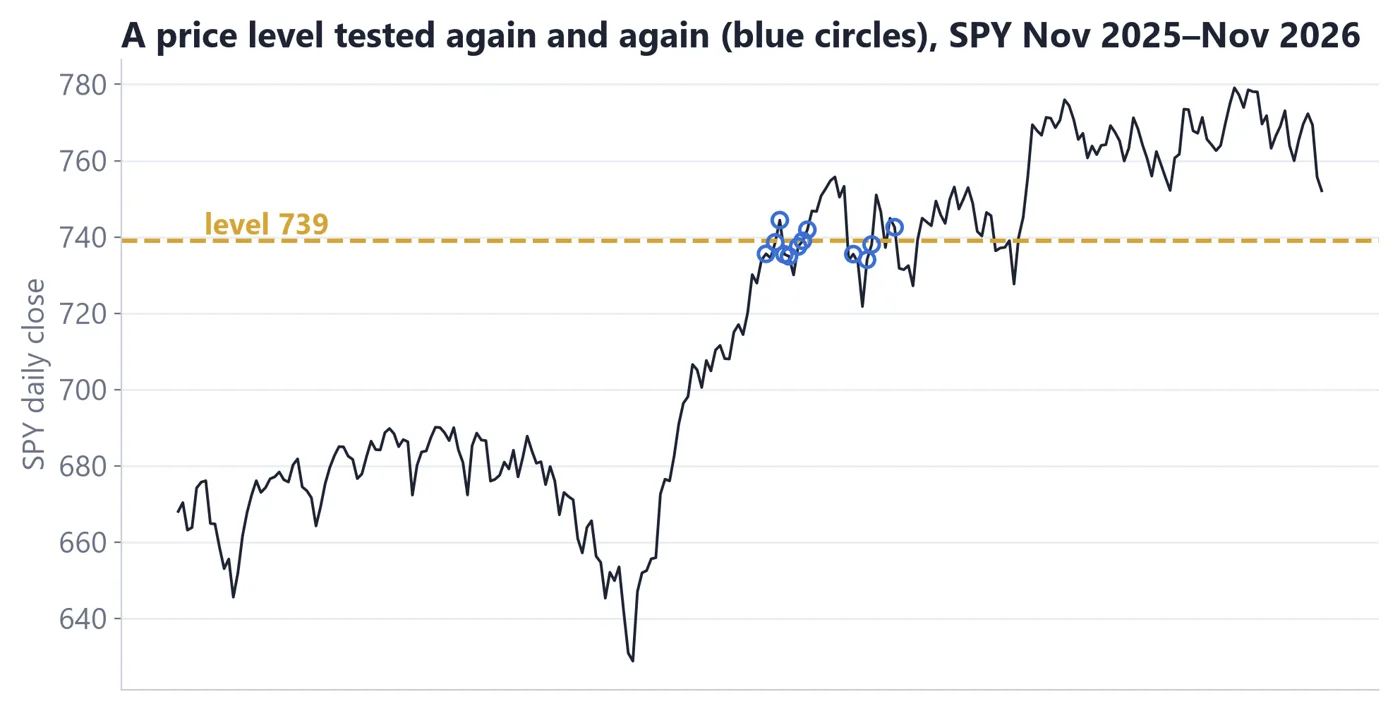
5.1 Levels where price reacted before
Support is a price area where buying has tended to appear, so a fall pauses or reverses. Resistance is a price area where selling has tended to appear, so a rise stalls. They are not promises. They are places where price reacted before, which is why traders watch them.
Real chart: a level tested several times, with a role reversal
How to read it
1The level was tested more than once. Each test is a data point.
2Notice that price does not turn on the exact tick; the level is a zone.
3When price breaks through, an old support can act as resistance (role reversal).
Real ES futures data (Yahoo Finance ES=F, 5-minute bars, regular session 9:30 AM–4:00 PM ET). Volume at price is approximated by spreading each 5-minute bar's volume across the prices it traded through.
Good levels come from prior highs and lows, round numbers (like 7,700), and previous days' highs, lows and closes. The more times a level held, the more traders have it marked, but more tests can also mean the level is weakening.
5.2 Zones and role reversal
Draw levels as zones, not single lines. Hypothetical example: ES has reacted around 7,760 several times, with turns at 7,758, 7,761 and 7,763. Treat it as a zone of 7,758 to 7,763, which is 5 points or 20 ticks wide, rather than a line at 7,760.
Role reversal: once price breaks above a resistance zone and holds, that zone may act as support on a retest, and the other way round. It is a common pattern, not a rule.
Mark obvious highs and lows on a higher timeframe.
Draw each as a zone, not a thin line.
Note how many times each has been tested.
Decide before the session what you will do if price breaks it.
Place a stop beyond the zone, where the idea is wrong.
5.3 A level is a plan, not a prediction
A level gives you three things: a place to look for a trade, a place for a stop (beyond the zone) and a way to measure reward. Hypothetical skipped example: you want to buy a bounce at 7,700, with a stop at 7,690, which is 10 points = 40 ticks = $500 on one ES, or $50 on one MES. The next resistance is only 8 points away. The reward is less than the risk, so you skip the trade. That is the level doing its job.
Key takeaways
Support and resistance are zones where price reacted before.
More tests build importance but can also wear a level out.
Role reversal is common but not a rule.
Use levels for entries, stops beyond the zone and reward measurement.
LESSON 5 · PRACTICE WORKSHEET
Lesson 5 practice: draw the zones
Pencil and ruler.
1Mark the level price tested at least three times. Draw it as a zone, not a line.
Show answer
Answers vary: check that the zone covers the repeated turns and is drawn with some width.
2Turns happened at 7,758, 7,761 and 7,763. How wide is the zone in points and ticks?
Show answer
7,763 - 7,758 = 5 points = 20 ticks.
3You buy at 7,700 with a stop at 7,690 on MES. Dollar risk per contract? The next resistance is 8 points away. Is reward larger than risk?
Show answer
10 points x $5 = $50 per MES. Reward 8 points = $40. No, reward is smaller than risk, so skip by a 1:1 minimum rule.
4On your own live chart (futures, stock or Bitcoin), mark the nearest support and resistance on the daily chart.
Show answer
Answers vary: check that zones are marked from prior highs and lows.
LESSON 6 · 10 MIN READ
Volume and sessions
🎯 You'll learn
What volume tells you and what it does not
The futures trading day: Asia, London and New York
Gaps and where to go next
6.1 Volume
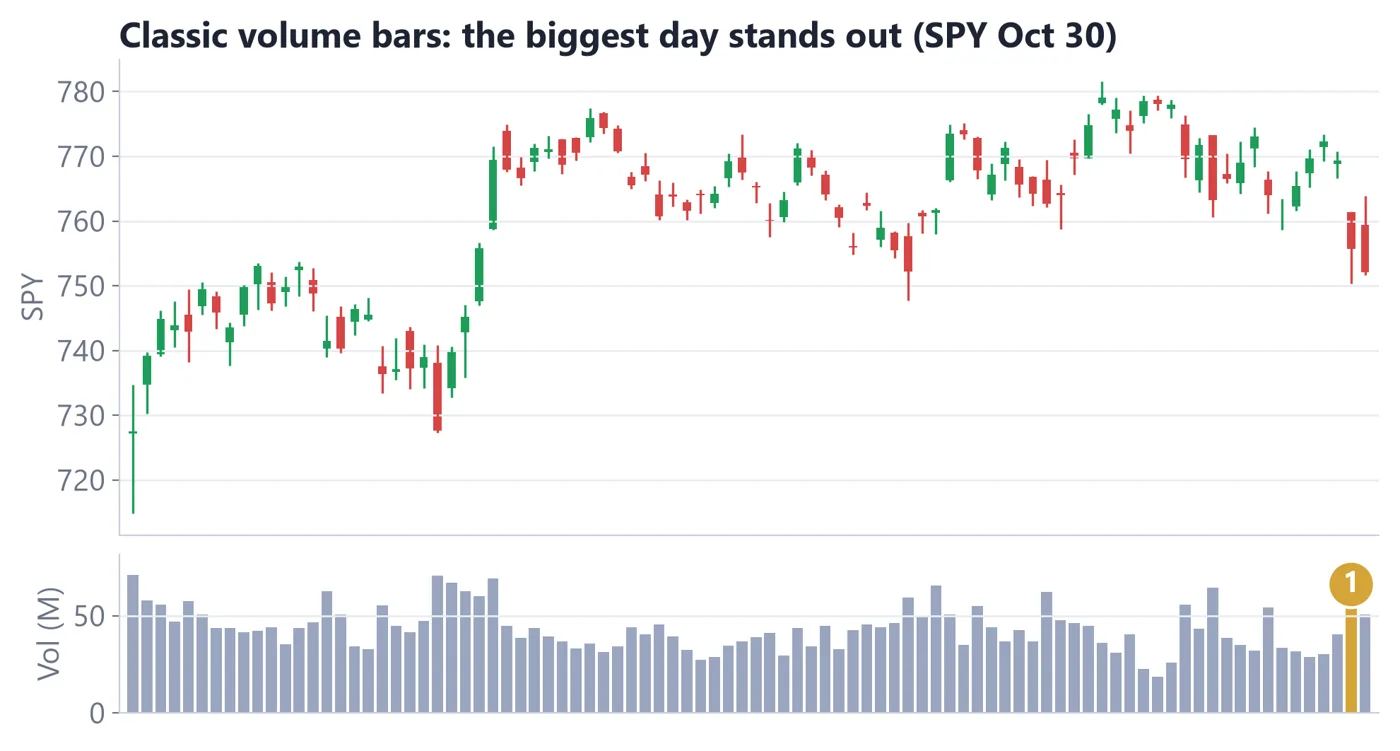
Volume is the number of contracts (or shares) traded in a period. The bars under a price chart show it. High volume means many participants traded; low volume means few did. A breakout through a level on rising volume is often read as more convincing than one on thin volume, although this is context, not proof.
Real data: price with volume bars and a volume spike on a breakout
How to read it
1The spike shows far more trading than the nearby bars.
2The breakout through a level came with the spike.
3Volume is a clue to participation, not a prediction of direction.
Real ES futures data (Yahoo Finance ES=F, 5-minute bars, regular session 9:30 AM–4:00 PM ET). Volume at price is approximated by spreading each 5-minute bar's volume across the prices it traded through.
Volume has a daily rhythm. It tends to be highest near the regular-session open (9:30 AM ET) and the close (4:00 PM ET), and lower around midday. Comparing a candle's volume to nearby candles matters more than the raw number.
6.2 Sessions
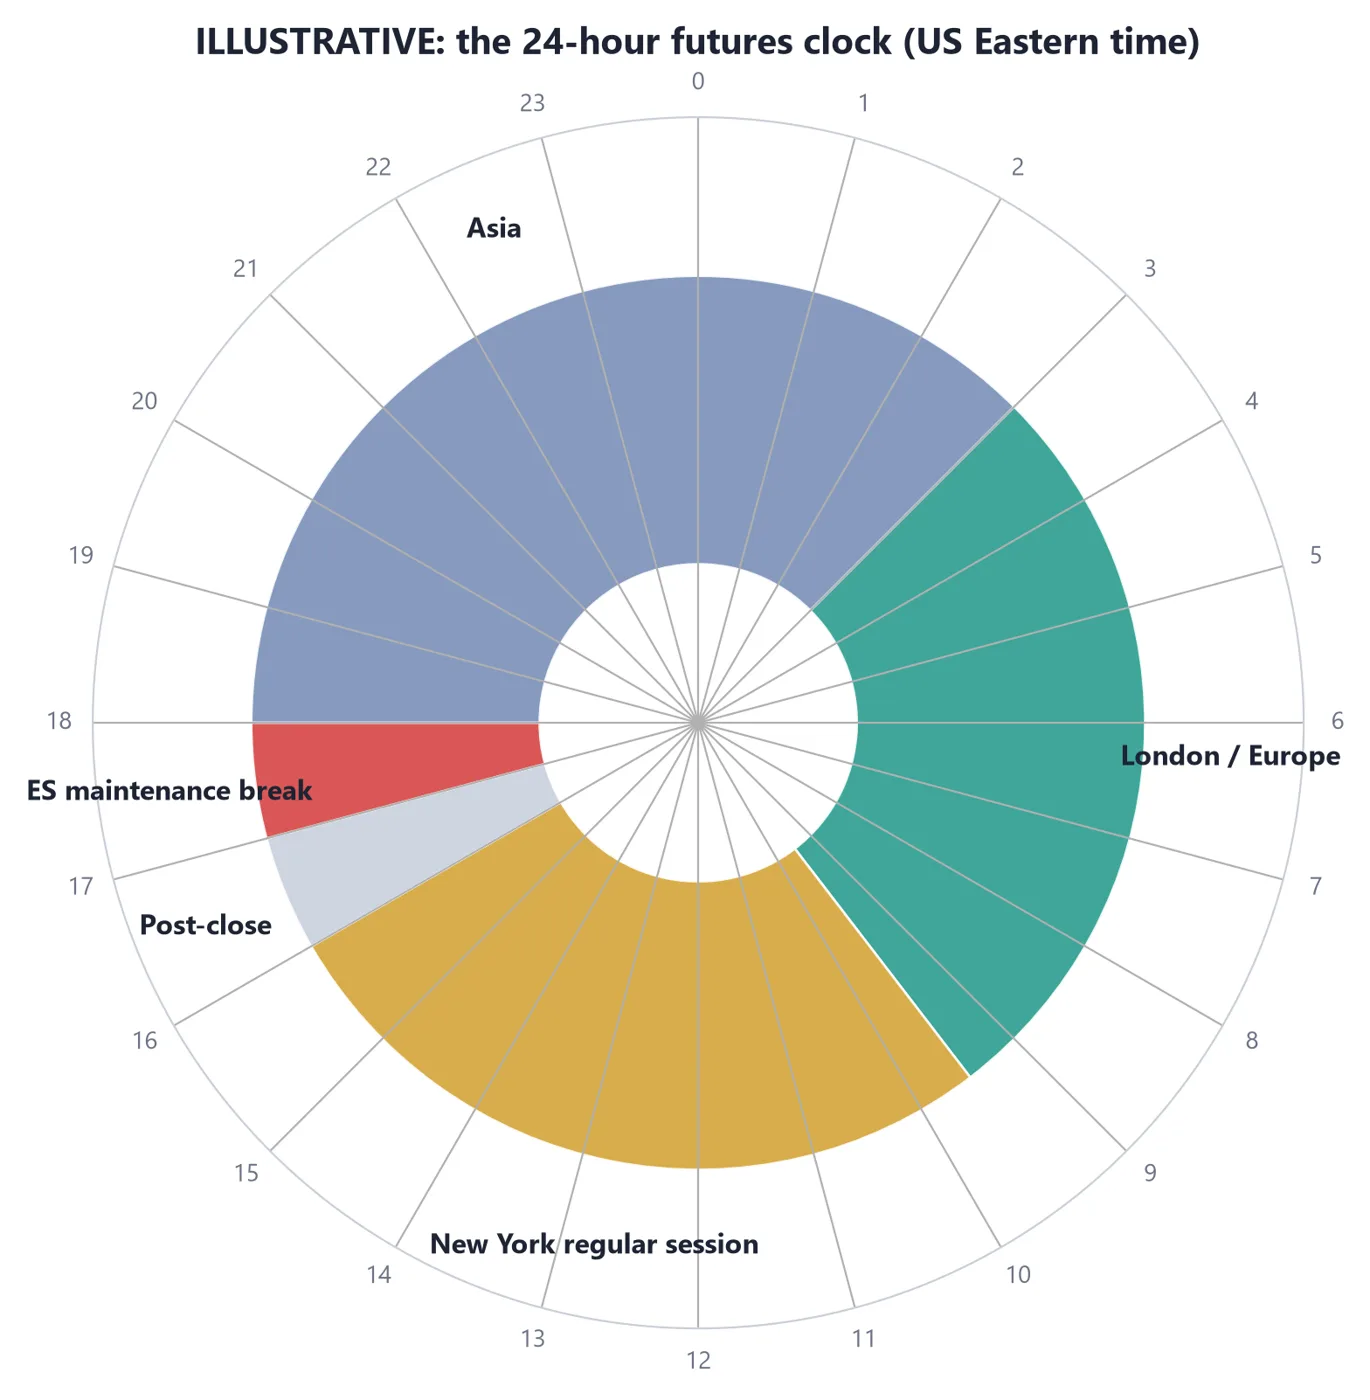
Index futures trade almost around the clock from Sunday evening to Friday afternoon ET, with a short daily maintenance break (check the CME schedule for current hours). Traders split the day into sessions named for the active markets: Asia, London and New York. Liquidity and volatility differ in each.
Illustrative: the 24-hour futures clock with Asia, London and New York sessions and the maintenance break
How to read it
1New York hours usually bring the most volume for US index futures.
2Overnight sessions are thinner, so moves can be choppier.
3The daily maintenance break is when the market pauses.
Illustrative diagram for teaching. Not real market data.
The regular trading hours (RTH) for US stocks are 9:30 AM to 4:00 PM ET. Futures also trade outside RTH in the overnight session, often called Globex.
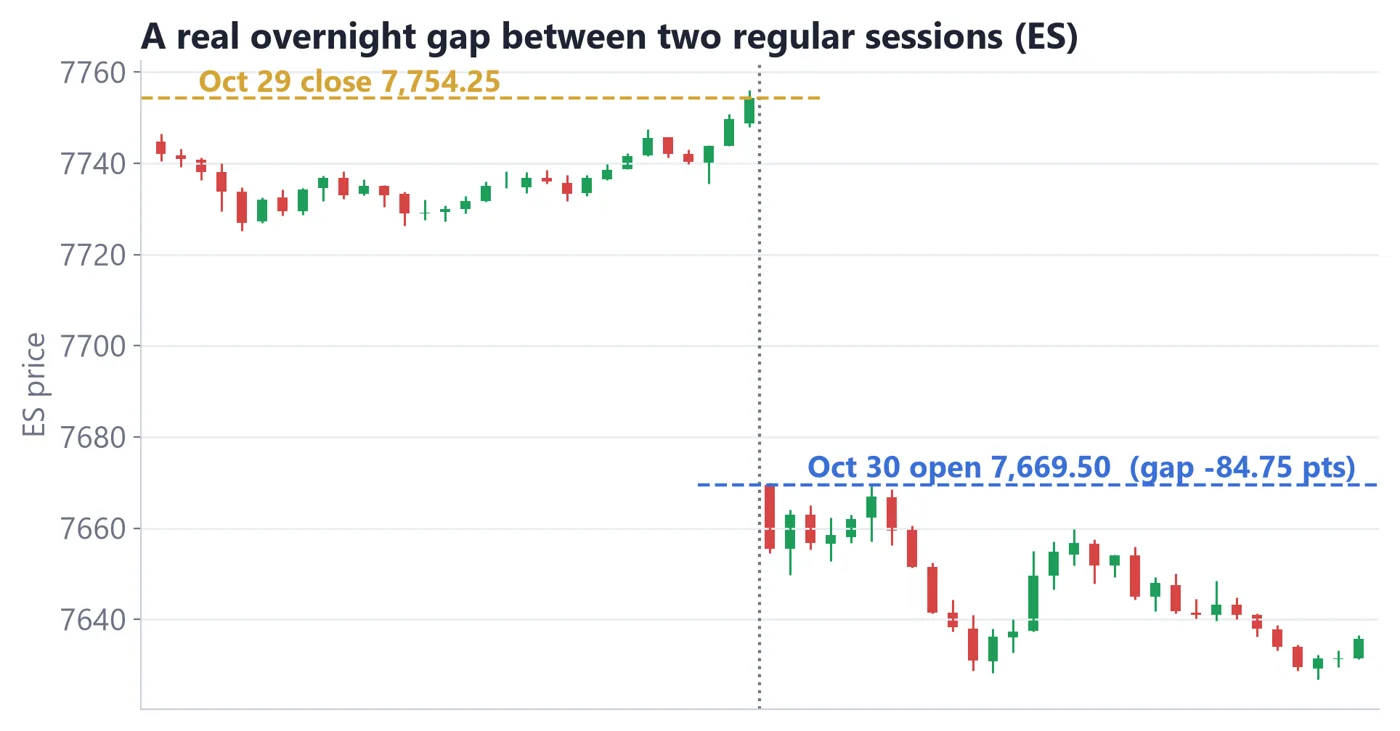
Real data: an overnight gap on ES (prior close versus next open)
How to read it
1The previous close is the last price of the earlier session.
2The next open is higher or lower, leaving a gap on the chart.
3A gap is a fact on the chart. Whether it fills is not certain.
Real ES futures data (Yahoo Finance ES=F, 5-minute bars, regular session 9:30 AM–4:00 PM ET). Volume at price is approximated by spreading each 5-minute bar's volume across the prices it traded through.
6.3 Where to go next
You now know what a futures contract is, how to read a candle, why timeframe matters, how to describe trend and structure, how to mark levels and how to read volume and sessions. That is the vocabulary. The next step is putting it into a repeatable routine, with risk limits, and practicing it on real charts.
That is what the book Learn to Trade in 31 Days ($29) is for: 31 short daily lessons covering futures and options, with printable worksheets on real ES, SPY and Bitcoin charts and an answer key. It is educational only and does not promise any result.
Key takeaways
Volume shows participation, not direction.
Index futures trade nearly 24 hours; the New York session has the most volume.
A gap is a fact; whether it fills is not certain.
Next step: the $29 book, Learn to Trade in 31 Days.
LESSON 6 · PRACTICE WORKSHEET
Lesson 6 practice: volume and sessions
Pencil.
1Circle the highest-volume bar. What was price doing at that time?
Show answer
Answers vary: check that the biggest bar was found and the price action described.
2Which session is the New York session? Which has the break?
Show answer
Answers vary with the diagram: check New York is identified and the maintenance break is located.
3Mark the prior close and the next open. How many points is the gap?
Show answer
Answers vary with the chart: gap = next open - prior close (use the absolute value).
4On your own live chart (futures, a stock or Bitcoin), find the highest-volume candle this week and write its time.
Show answer
Answers vary: check you wrote a time and noted Bitcoin trades 24/7 if you chose it.
Quick check answers
Lesson 1: Q1 B, Q2 B, Q3 B
Lesson 2: Q1 A, Q2 A, Q3 B
Lesson 3: Q1 B, Q2 A, Q3 A
Lesson 4: Q1 A, Q2 B, Q3 B
Lesson 5: Q1 A, Q2 A, Q3 A
Lesson 6: Q1 A, Q2 B, Q3 A
Worksheet answer key
Lesson 1: Lesson 1 practice: the contract
MES: 12 x $5 = $60. ES: 12 x $50 = $600.
NQ: 40 x $5.00 = $200. MNQ: 40 x $0.50 = $20.
Answers vary with the chart: check that you compare the lines and note Bitcoin trades continuously.
Answers vary: check that you looked up the contract specification (for example MES 0.25 = $1.25).
Lesson 2: Lesson 2 practice: read the candles
Open, high, low, close. The close is at the top of a green candle's body.
Answers vary: check that highs and lows are compared in order.
Lesson 5: Lesson 5 practice: draw the zones
Answers vary: check that the zone covers the repeated turns and is drawn with some width.
7,763 - 7,758 = 5 points = 20 ticks.
10 points x $5 = $50 per MES. Reward 8 points = $40. No, reward is smaller than risk, so skip by a 1:1 minimum rule.
Answers vary: check that zones are marked from prior highs and lows.
Lesson 6: Lesson 6 practice: volume and sessions
Answers vary: check that the biggest bar was found and the price action described.
Answers vary with the diagram: check New York is identified and the maintenance break is located.
Answers vary with the chart: gap = next open - prior close (use the absolute value).
Answers vary: check you wrote a time and noted Bitcoin trades 24/7 if you chose it.
Glossary
Break of structure
Price breaking the last swing that defined a trend.
Candlestick
A chart symbol showing open, high, low and close for one period.
Futures contract
A standardized agreement to buy or sell an asset at a set price on a future date.
Gap
A jump between the prior close and the next open.
Micro contract
A contract one tenth the size of the standard one (MES, MNQ).
Session
A part of the trading day such as Asia, London or New York.
Support / resistance
Price areas where buying / selling has tended to appear.
Swing high / low
A peak or valley in price.
Tick
The smallest price move of a contract; ES 0.25 = $12.50.
Timeframe
How much time each candle represents.
Volume
The number of contracts or shares traded in a period.
Wick
The thin line on a candle showing the high or low beyond the body.
WHITE FEATHER FINANCE
What's next
Next: continue with Learn to Trade in 31 Days ($29), which covers futures and options with printable worksheets on real charts and an answer key. It is educational only.
The main bookLearn to Trade in 31 Days: futures + options, one lesson a day. wfeatherfinance.com/learn-to-trade-31-days
The free library8 free downloads + 4 Field Guides at wfeatherfinance.com/free-library
Daily market shortsYouTube, TikTok and X: @WFeatherFinance