Lesson 1 · 8 min
What Volume Profile Shows You
You’ll learn
- The difference between volume over time and volume at price
- How charting software builds a profile, row by row
- The five levels every profile has: POC, VAH, VAL, HVN, LVN
1.1 When vs where
The volume bars under a normal chart answer one question: when did trading happen? Volume Profile answers a different one: where, at which prices, did trading happen? It adds up every contract traded at each price and draws the total as a horizontal bar beside the price axis.
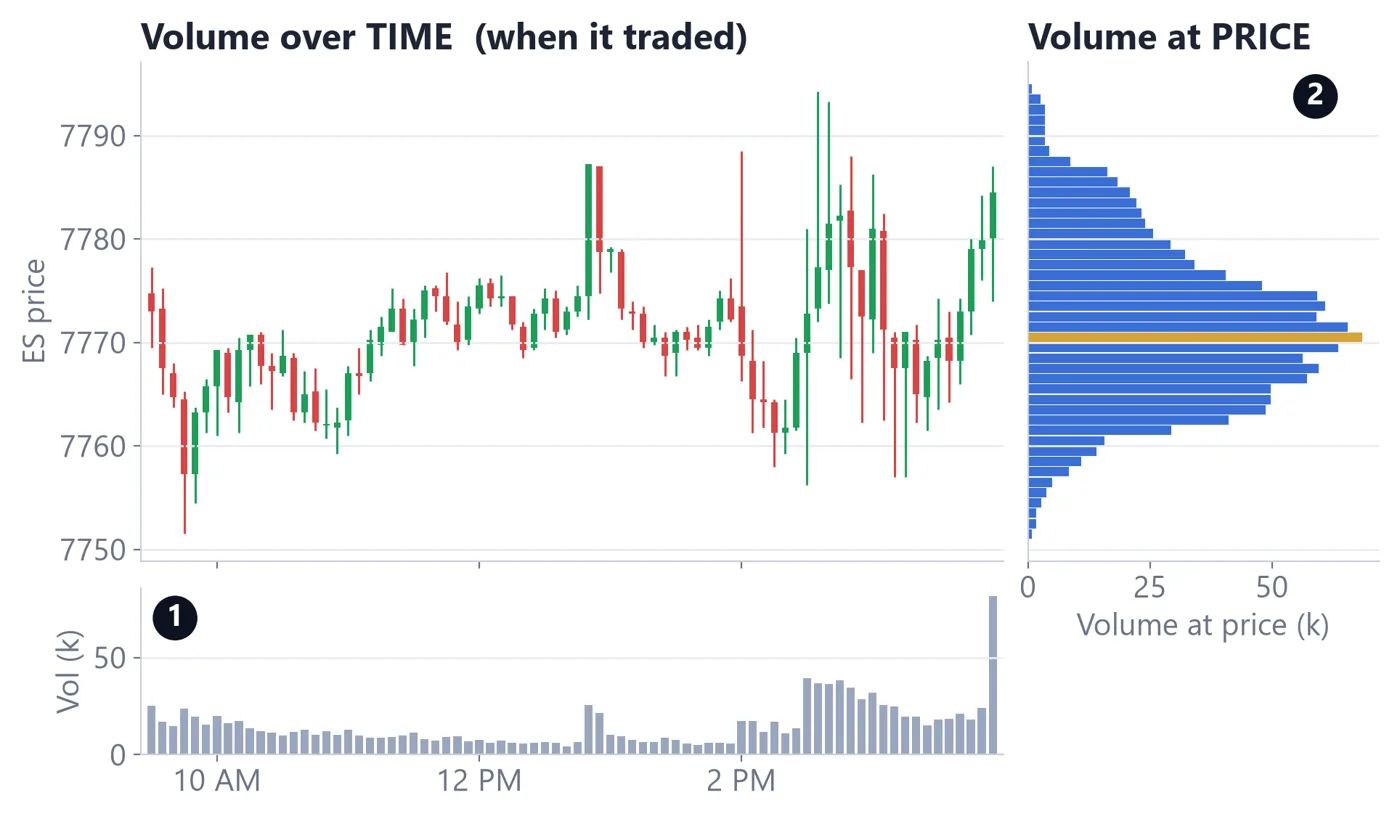
How to read it
- 1Volume over time: busy at the open and into the close, quiet at lunch.
- 2Volume at price: most contracts changed hands near 7,770.75 (gold), even though price visited 7,751–7,794.
Real ES futures data (Yahoo Finance ES=F, 5-minute bars, regular session 9:30 AM–4:00 PM ET). Volume at price is approximated by spreading each 5-minute bar's volume across the prices it traded through.
1.2 How the profile is built
Your charting software does this for you, but knowing the steps helps you read the result:
- Pick a time window: usually one regular trading session (9:30 AM–4:00 PM ET for ES).
- Split price into rows: on ES each row is often one tick, 0.25 points.
- Count the contracts traded in each row.
- Draw a bar for each row, as long as its volume. The longest bar is the POC.
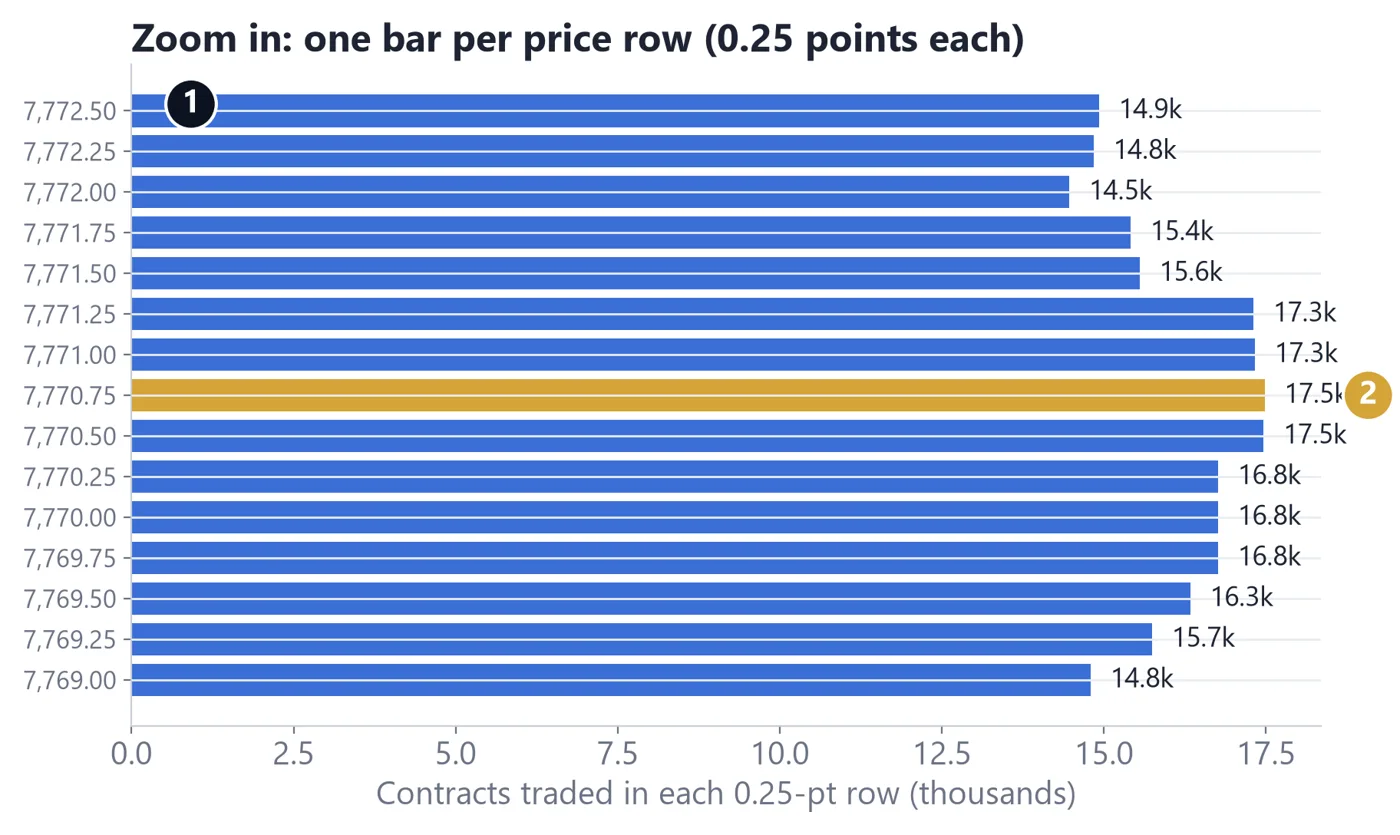
How to read it
- 1Each bar is one price row. The number is how many contracts traded there.
- 2The longest bar (7,770.75) is the Point of Control: the busiest price of the day.
Real ES futures data (Yahoo Finance ES=F, 5-minute bars, regular session 9:30 AM–4:00 PM ET). Volume at price is approximated by spreading each 5-minute bar's volume across the prices it traded through.
1.3 The five levels to know
| Level | What it is | Why traders watch it |
|---|---|---|
| POC Point of Control | The single busiest price | The day's 'fair price' reference |
| VAH Value Area High | Top of the zone holding ~70% of volume | Upper edge of 'accepted' prices |
| VAL Value Area Low | Bottom of that zone | Lower edge of 'accepted' prices |
| HVN High-volume node | A fat part of the profile | Price spent time and agreed here |
| LVN Low-volume node | A thin part of the profile | Price moved through quickly |
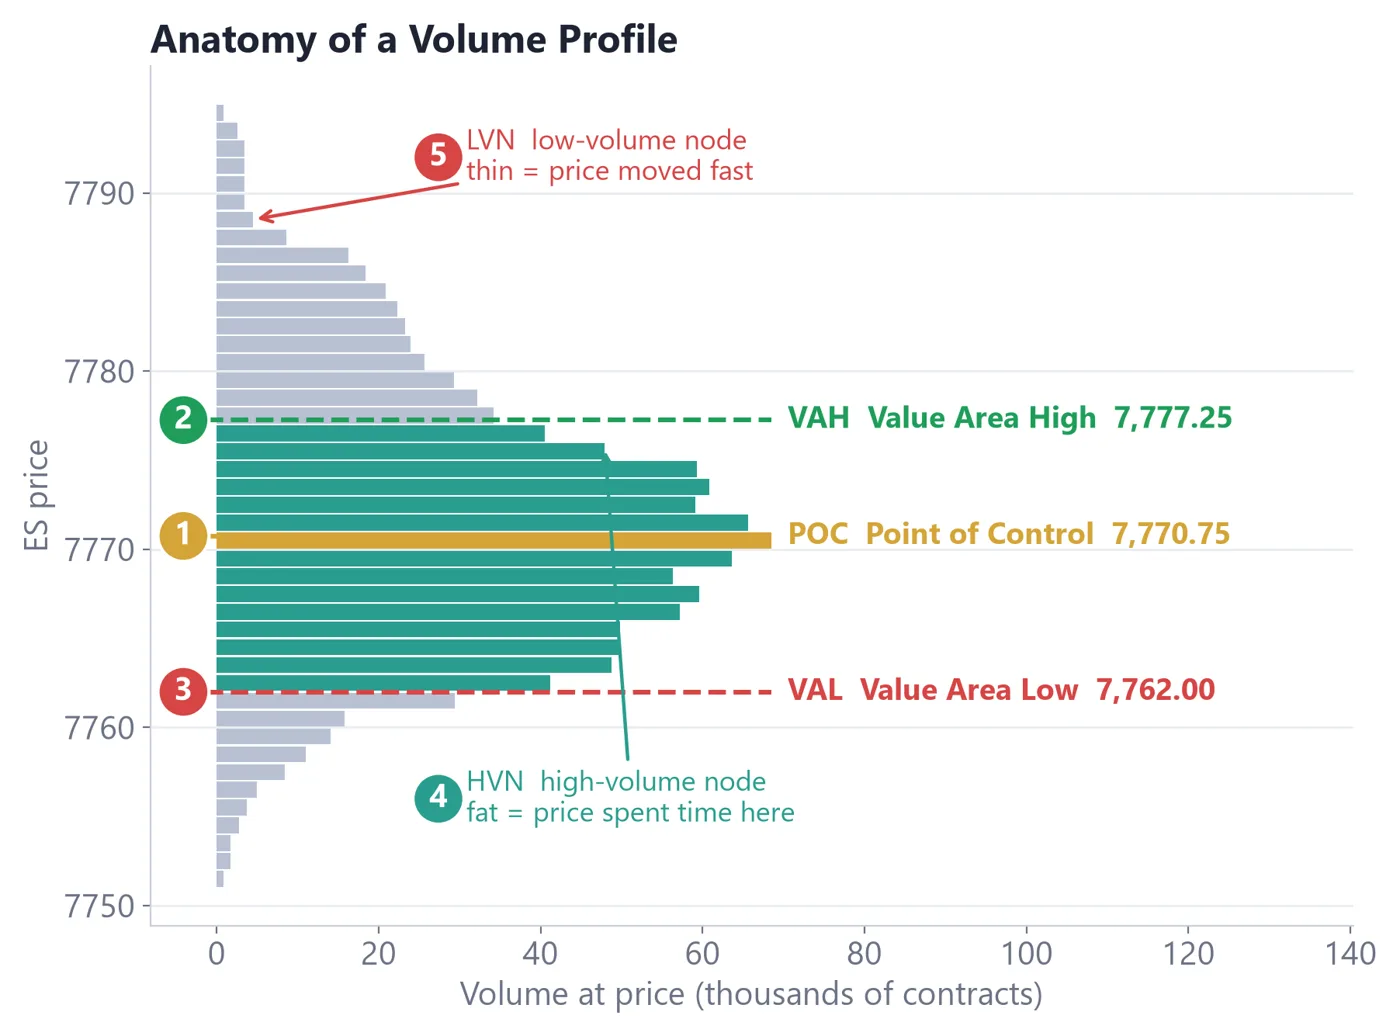
How to read it
- 1POC 7,770.75: the busiest price.
- 2VAH 7,777.25: top of the value area.
- 3VAL 7,762.00: bottom of the value area.
- 4HVN: the fat middle, where buyers and sellers agreed.
- 5LVN: the thin tail, where price passed quickly.
Real ES futures data (Yahoo Finance ES=F, 5-minute bars, regular session 9:30 AM–4:00 PM ET). Volume at price is approximated by spreading each 5-minute bar's volume across the prices it traded through.
Key takeaways
- Volume Profile counts volume by price, not time.
- The POC is the busiest price; the Value Area holds ~70% of volume.
- Fat areas (HVN) = agreement and slow trade. Thin areas (LVN) = fast moves.
- Levels are references for attention, never guarantees of a reaction.
Quick check
Pass with 2 of 3 to complete the lesson (+20 XP, plus 5 XP per correct answer the first time).
1.A Volume Profile shows volume organised by…
2.The longest bar on the profile is called the…
3.A thin part of the profile (an LVN) usually means price…