Lesson 4 · 11 min
Expectancy: win rate versus reward:risk
You’ll learn
- How to calculate expectancy in R
- Why win rate alone says nothing without reward:risk
- How costs and small samples can mislead you
4.1 The expectancy formula
Expectancy is the average result per trade over many trades, measured in R. Formula: Expectancy = (win rate x average win in R) - (loss rate x average loss in R). A positive number means the approach averaged a gain over the sample; zero or negative means it did not. It describes past data. It does not predict the next trade.
Hypothetical example: you win 40% of trades. Winners average +2R, losers average -1R. Expectancy = (0.40 x 2) - (0.60 x 1) = 0.80 - 0.60 = +0.20R per trade. At 1R = $100 that is $20 per trade on average before costs. Over 100 trades that sample would show about +20R, or $2,000, but any individual run can be better or worse.
Second example: you win 60% of trades but winners average only +0.5R while losers average -1R. Expectancy = (0.60 x 0.5) - (0.40 x 1) = 0.30 - 0.40 = -0.10R. You win more than half your trades and still lose money on average. That is why win rate alone is a poor scoreboard.
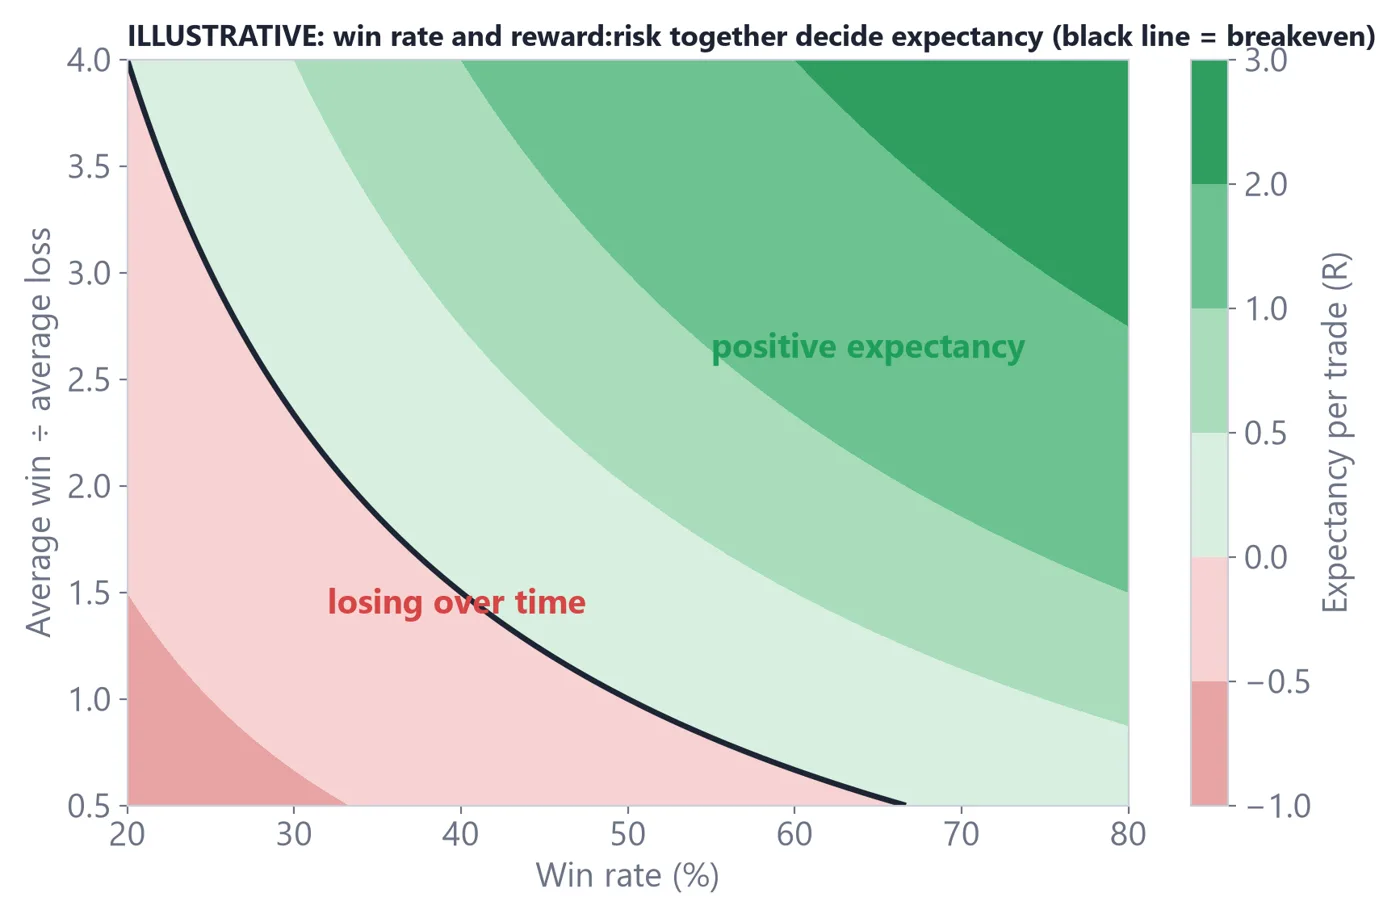
- 1Each cell combines a win rate with an average reward:risk.
- 2The breakeven line separates positive from negative expectancy.
- 3Moving right or up helps, but real trading rarely lets you raise both at once.
4.2 Breakeven win rate
For a given reward:risk ratio (RR), the win rate you need just to break even (before costs) is 1 / (1 + RR). Look at the table. The higher your reward relative to risk, the lower the win rate you need, but targets that are farther away are also reached less often.
| Reward:risk | Breakeven win rate | Check |
|---|---|---|
| 0.5 : 1 | 66.7% | 0.667 x 0.5 - 0.333 x 1 = 0 |
| 1 : 1 | 50% | 0.5 x 1 - 0.5 x 1 = 0 |
| 2 : 1 | 33.3% | 0.333 x 2 - 0.667 x 1 = 0 |
| 3 : 1 | 25% | 0.25 x 3 - 0.75 x 1 = 0 |
More hypothetical examples: win 30% at an average +3R: (0.30 x 3) - (0.70 x 1) = 0.90 - 0.70 = +0.20R. Win 70% at +0.5R: (0.70 x 0.5) - (0.30 x 1) = 0.35 - 0.30 = +0.05R, barely above breakeven, and commissions could erase it. A strategy with a high win rate and small winners is exposed to costs and to one large loss.
Options trades carry the same logic. A defined-risk credit spread that often earns a small win has a lopsided max loss. Collect $1.50 on a 5-wide spread and the max loss is $350 against a $150 max profit, so you must win about 70% of the time to break even (350 / (350 + 150) = 0.70). That is not a verdict on the strategy, just the arithmetic you should know before you start.
4.3 Costs and sample size
Costs come off every trade. If average costs are 0.1R per trade, a +0.20R expectancy becomes +0.10R, which is half the edge. Include commissions, fees and typical slippage in your R numbers or your expectancy will look better than it is.
Sample size matters too. A heuristic often shared in trading education: results from fewer than about 30 trades are too few to say much, and 100 or more starts to be more informative. That is a rule of thumb, not a statistical test. Twenty trades can look great or terrible purely by luck, so avoid changing your approach after a small run.
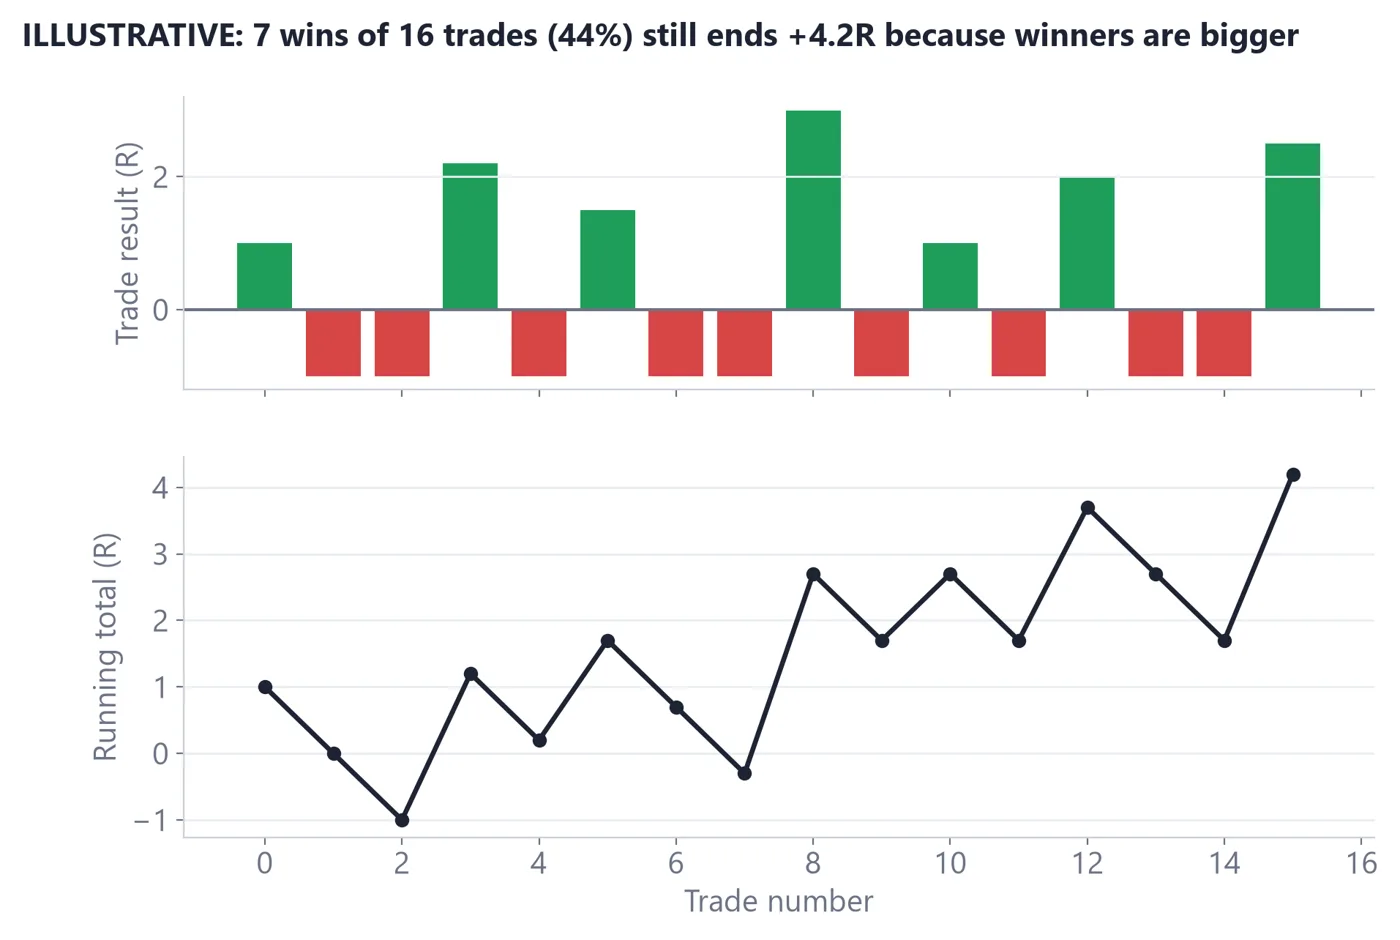
- 1The curve rises on average but has flat spots and dips.
- 2A losing streak is a normal part of a positive-expectancy sequence.
- 3Judge the process over many trades, not over the last three.
- Expectancy = (win rate x avg win in R) - (loss rate x avg loss in R).
- Win rate means little without reward:risk; breakeven win rate = 1 / (1 + RR).
- Costs reduce expectancy; include them in R.
- Small samples mislead; fewer than about 30 trades is a heuristic warning, not proof either way.
Quick check
Pass with 2 of 3 to complete the lesson (+20 XP, plus 5 XP per correct answer the first time).
1.Win rate 40%, average win +2R, average loss -1R. What is the expectancy?
2.What is the breakeven win rate at 2:1 reward:risk (before costs)?
3.Win rate 60%, average win +0.5R, average loss -1R. What follows?