Lesson 7 · 10 min
VWAP and standard-deviation bands
You’ll learn
- What VWAP is and how it is calculated
- How standard-deviation (SD) bands are drawn around it
- Why trend days can stay beyond the outer bands
1.1 What VWAP is
VWAP stands for volume-weighted average price. It is the average price traded since a starting point, where each price counts in proportion to the volume that traded there. In words: add up (price x volume) for every trade since the start, then divide by the total volume. A price with heavy volume pulls the average toward itself more than a price with light volume.
Most platforms start the calculation at the beginning of a session and let it run to the end. It resets the next session. Because it is cumulative, VWAP moves quickly early in the day and slowly later, when it carries many hours of history.
VWAP is a backward-looking average. It describes where trade has happened so far. It is a reference line that many traders watch, which is a reason it is worth knowing. It is not a forecast, and price is under no obligation to return to it.
A tiny example makes the formula concrete. Suppose 10 contracts trade at 5,000.00 and 30 contracts trade at 5,001.00. The VWAP is (5,000.00 x 10 + 5,001.00 x 30) / 40 = 200,030 / 40 = 5,000.75. The average sits closer to 5,001.00 because more volume traded there. A simple average of the two prices would be 5,000.50, so volume weighting matters.
1.2 Standard-deviation bands
A standard deviation (SD) is a measure of how spread out numbers are around an average. Platforms draw bands at plus and minus 1 SD, 2 SD and sometimes more around VWAP. A move to the +2 SD band means price has stretched far from the day's average price compared with the spread so far.
It is tempting to say the bands show where price is 'statistically unlikely' to go. That is not a safe reading. Market prices are not neatly bell-shaped, and bands widen and shift as the day goes on. Trend days can live beyond 2 SD, or ride along an outer band for hours. The bands describe stretch. They do not mark a limit.
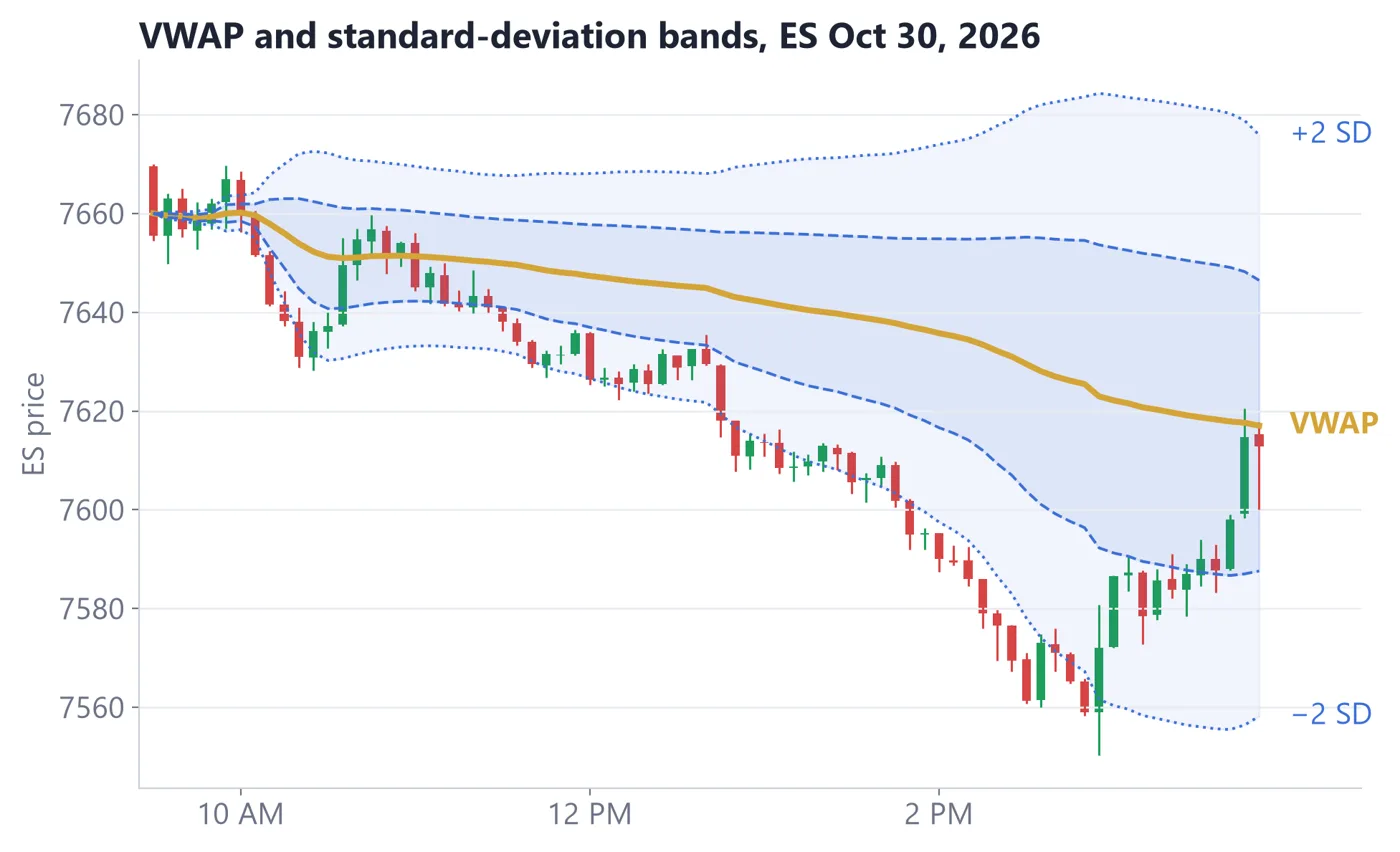
- 1Oct 30, 2026 was a trend day down with an intraday range of about 196 points.
- 2Price rode the -1 to -2 SD bands all through the afternoon instead of snapping back to VWAP.
- 3The VWAP line itself kept sloping down, so the 'average' was being dragged lower all day.
1.3 Reversion days and trend days
Some days price stretches away from VWAP and then returns to it. Traders call these reversion days. Other days price moves away and stays on one side: trend days. The difficulty is that on the morning of a trend day, it can look just like the start of a reversion day.
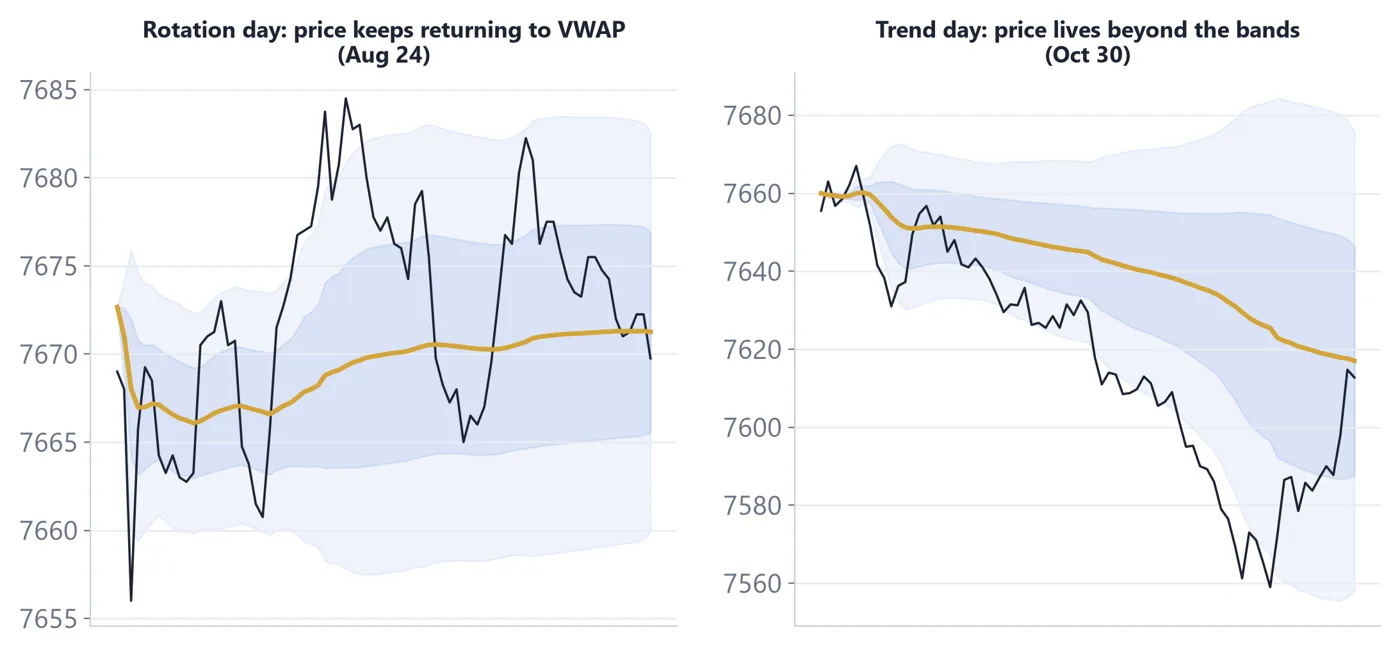
- 1Left: price stretches, then comes back to VWAP several times.
- 2Right: price stays on one side and tracks the outer bands.
Because you cannot tell in advance which type of day it will be, VWAP and its bands work best as context. Useful questions are: Is price above or below VWAP? Is VWAP sloping up or down? How far has price stretched, and has that stretch been growing or shrinking? If every pullback toward VWAP stops short and price turns away, the day is behaving like a trend day, and the idea of 'it must revert' deserves doubt.
A note on the settings: your platform may anchor VWAP to the regular session, or the full 23-hour session. Both are legitimate; they give different lines. Pick one and keep it so your notes stay comparable.
- VWAP = cumulative (price x volume) divided by cumulative volume since the start.
- SD bands measure how stretched price is from VWAP; they are not limits.
- Trend days can stay beyond 2 SD, as on Oct 30, 2026.
- Use VWAP and its slope as context, not as a prediction.
Quick check
Pass with 2 of 3 to complete the lesson (+20 XP, plus 5 XP per correct answer the first time).
1.What does VWAP measure?
2.What can happen on a trend day?
3.Is VWAP a forecast?