Lesson 4 · 10 min
Cumulative delta and divergence
You’ll learn
- How cumulative delta (CVD) is built from bar delta
- What a divergence between price and CVD looks like
- Why divergences can fail and how to treat them
4.1 Adding up the deltas
Cumulative delta (often written CVD) is a running total of bar delta. Start at zero at some starting point, usually the start of the session. Add each new bar's delta. Positive delta lifts the line; negative delta pulls it down.
The result is a line that shows the net direction of aggression since the starting point. Because it depends on that starting point, always check where your platform resets it (for example at the session open). Two charts with different resets show different lines.
Different platforms may show CVD as a line, as candles, or as an oscillator that resets each bar. These are the same data drawn differently. Make sure you know which version you are looking at, and keep the same one while you practise so that readings stay comparable from day to day.
4.2 What a divergence is
A divergence happens when price and an indicator move in different directions. With CVD, the classic example is price making a higher high while CVD makes a lower high. In the three bars above, price made new highs each time, yet CVD peaked at 95 on Bar 2 and fell to 32 on Bar 3.
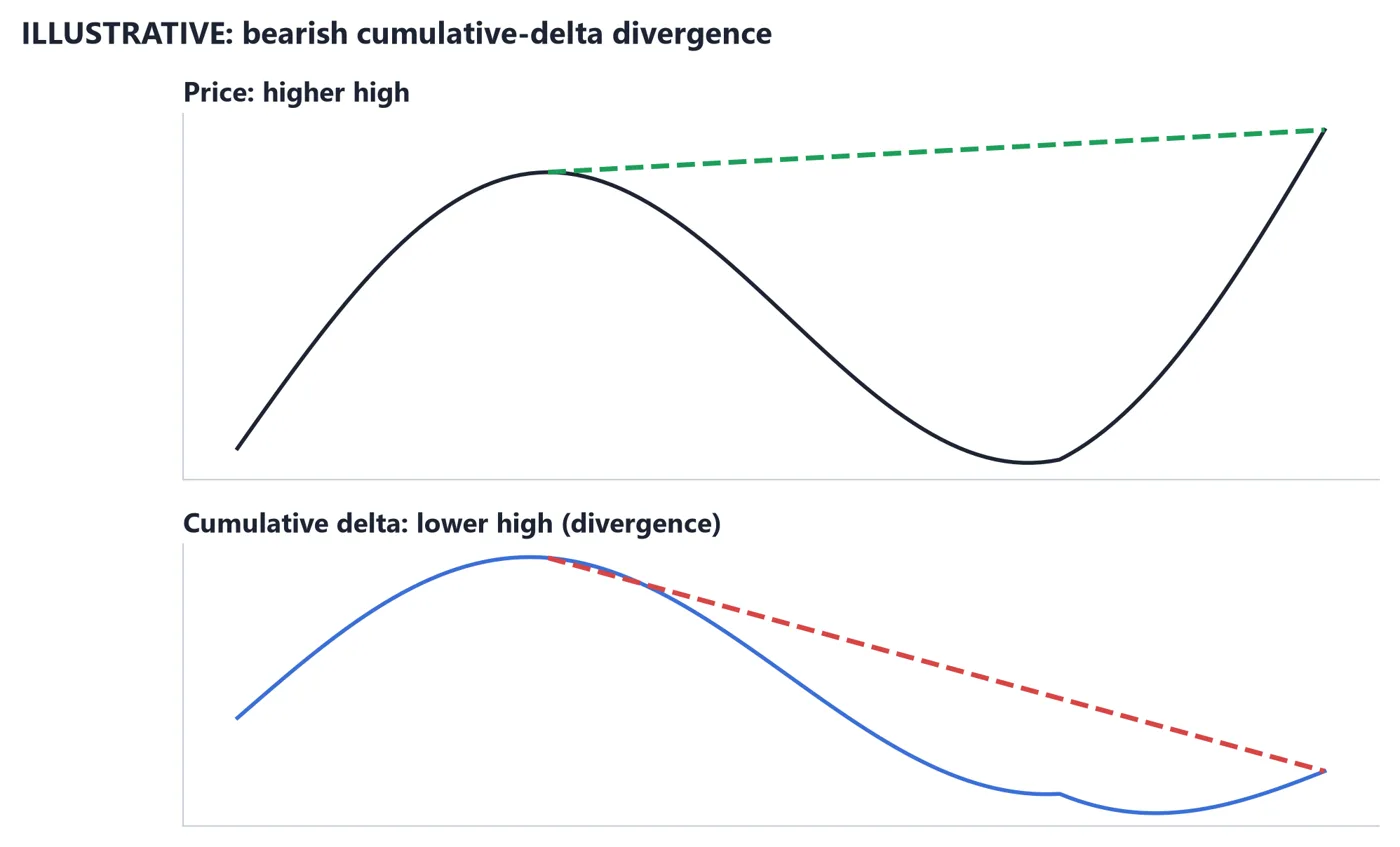
- 1Price: each swing high is above the last.
- 2CVD: the second high is below the first. Fewer net aggressive buyers went into the second push.
The same idea works in reverse: price makes a lower low while CVD makes a higher low. The meaning is consistent with the move losing support from aggressive participants. It could mean passive orders are absorbing the move, or that the move is simply running out of interest.
Divergences are also easy to over-see. If you look hard enough you can find a divergence on almost any chart, because two noisy lines will often point in different directions over short windows. To keep yourself honest, write down in advance what counts: for example 'two consecutive swing highs on the 5-minute chart, at least ten bars apart'. Fixed definitions stop you from fitting the pattern after the fact.
4.3 Why divergences can fail
A divergence describes the past and the present. It does not say when, or whether, price will turn. Strong trends can show divergences for a long time while price keeps going. Also, CVD can be distorted by one large order, by the choice of reset point, and by contract rolls.
So treat a divergence as one piece of context. Questions to ask: Is it happening at a level I already marked? Did price stall afterwards, or keep going? What would show me I am wrong? Always decide where you would be wrong before looking for any other confirmation.
Finally, remember what CVD cannot tell you. It cannot tell you about orders that never traded, such as large resting limit orders that were cancelled. It cannot tell you who is on the other side. And it cannot tell you the future. What it can do is give you an organised record of aggression, which you can compare with what price did.
- CVD is the running total of bar delta from a chosen reset.
- A divergence is price and CVD moving in different directions.
- Divergences can persist or fail; they are context, not predictions.
- Always check where your CVD resets.
Quick check
Pass with 2 of 3 to complete the lesson (+20 XP, plus 5 XP per correct answer the first time).
1.How is cumulative delta built?
2.Price makes a higher high and CVD a lower high. What is it called?
3.Which is the best way to treat a divergence?