Lesson 3 · 10 min
Delta and the four price-vs-delta scenarios
You’ll learn
- How to calculate bar delta
- The four combinations of price direction and delta
- Why disagreement between price and delta is worth noticing
3.1 What delta is
Delta is the difference between aggressive buying and aggressive selling in a period. The formula never changes: delta = ask volume - bid volume. A positive delta means buyers were more aggressive. A negative delta means sellers were more aggressive.
Delta is calculated for each bar by adding all the ask volume, adding all the bid volume, and subtracting. You can also see delta for each row, but bar delta is the number most traders look at first.
Delta only measures aggression. It does not measure everything. Passive orders that were not hit do not appear in it at all.
Notice how the same shapes appear again and again. A bar with a small body but huge volume often hides a fight: lots of aggression, very little progress. The delta may even be lopsided and still tell you little about direction until you see what price does next. That is why delta is always read with price, never alone.
3.2 Two up bars, two different stories
Both bars below close higher than they open. A candlestick trader would say they look similar. Their footprints tell different stories.
Bar 1 has delta +175. Aggressive buyers were active and price rose. Bar 2 has delta -92. Sellers were more aggressive, yet price still closed higher. Something on the other side absorbed their selling, such as passive buyers waiting at the bid. That is one possible reading. Another is short covering, where traders who sold earlier buy back to close. We cannot tell from the numbers which it was.
Also compare each bar with the one before. If delta has been positive for five bars and then turns sharply negative while price is still near the high, that change in behaviour is more informative than any single number. Changes in behaviour are often more useful to study than absolute levels.
3.3 The four scenarios
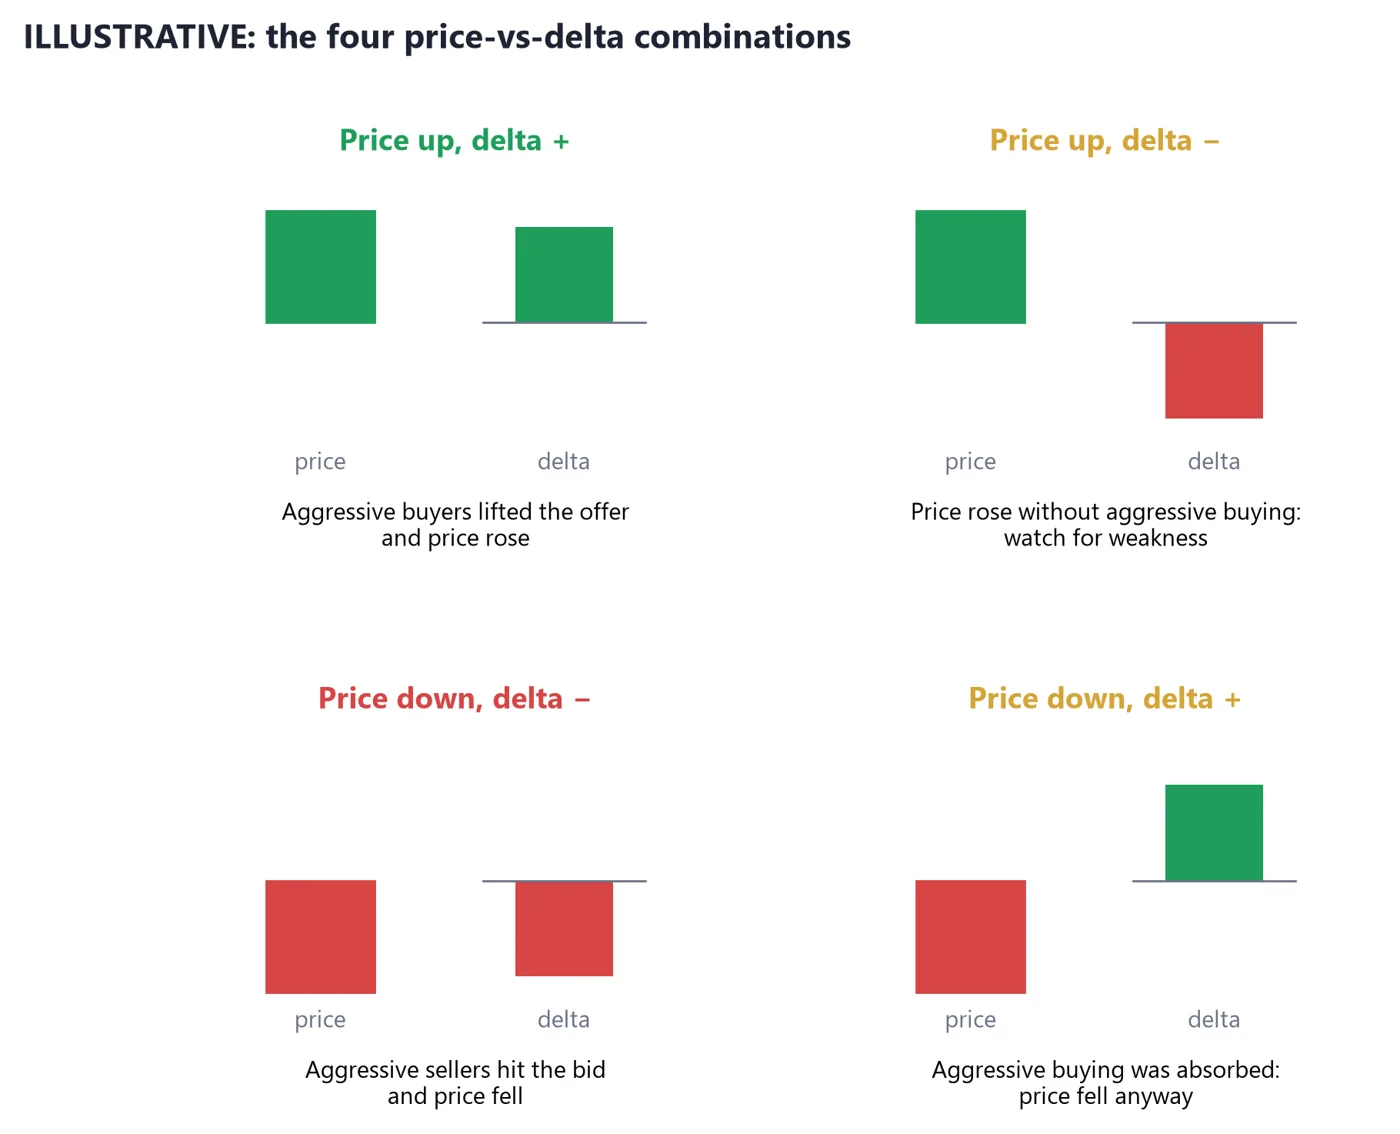
- 1Price up and delta positive: aggressive buying and price agree.
- 2Price up and delta negative: price rose even though sellers were more aggressive. A disagreement worth noting.
- 3Price down and delta negative: aggressive selling and price agree.
- 4Price down and delta positive: price fell even though buyers were more aggressive. Also a disagreement.
Two of the four are agreement: the market moved the way the aggressive side pushed. Two are disagreement: price moved against the aggressive side. Disagreement is not a trade signal by itself. It is a prompt to ask why, and to look at where on the chart it happened.
Context matters. Disagreement at a level you already marked (for example the prior day's value area edge from Supplement 1) is more interesting than disagreement in the middle of nowhere. Even then, it is context for a decision, not a prediction of what comes next.
A short routine helps: (1) read the delta number, (2) check whether price agreed, (3) note the location on the chart, (4) write down what would make the reading wrong. Four lines in a notebook beat a dozen indicators on screen. Over a few weeks you will see which readings were useful and which were noise, and you will have records rather than memories.
- Delta = ask volume - bid volume.
- Positive delta means buyers were more aggressive; negative means sellers were.
- Price and delta can agree or disagree; disagreement is context, not a signal on its own.
- Judge delta relative to the bar's total volume and its location on the chart.
Quick check
Pass with 2 of 3 to complete the lesson (+20 XP, plus 5 XP per correct answer the first time).
1.A bar has 500 contracts at the ask and 620 at the bid. What is its delta?
2.Price rises and delta is negative. Which phrase fits best?
3.Which two scenarios are 'agreement'?