Lesson 8 · 10 min
Using futures-style context for strikes and timing
You’ll learn
- How VWAP and its bands give context for option timing
- How value areas and key levels can frame strike choice
- How to log a failed idea and a skipped idea, and why both matter
8.1 Context, not a signal
If you read charts as a futures trader, you already own useful tools: VWAP (the volume-weighted average price for the session), its standard-deviation bands, value areas, and key levels like prior highs and lows. Options do not replace these tools. They change the question. For futures you ask 'where do I enter and where is my stop?' For options you also ask 'where is my breakeven, how much time do I have, and what am I paying for volatility?'
Chart context cannot tell you what will happen. It can show whether the price is sitting inside the day's usual range or living outside it, and that affects which questions are reasonable. This lesson uses the same ES charts as the earlier guides. Prices there are real ES futures; all option numbers here are hypothetical.
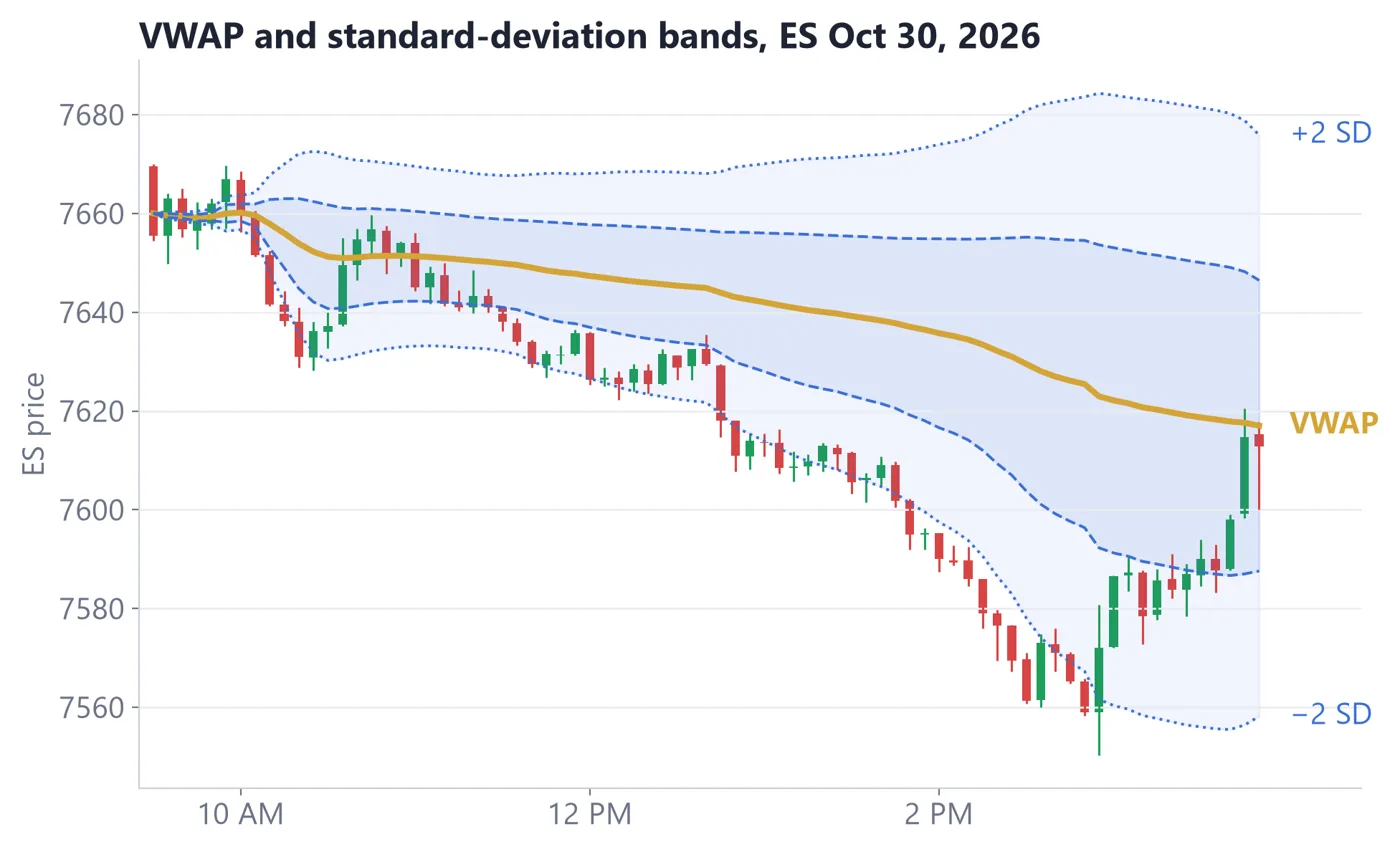
- 1VWAP is the running volume-weighted average price for the session.
- 2The inner bands mark 1 standard deviation from VWAP and the outer bands mark 2.
- 3On a trend day, price can stay beyond the bands for hours instead of snapping back.
- 4A reversion idea needs a different plan than a trend idea.
8.2 Value area and strike choice
A value area is the price range containing about 70% of a day's volume, with a point of control (POC) at its busiest price. Some traders watch the previous day's value area high (VAH), low (VAL) and POC as levels where price tends to react, or fail to. Context, not a prediction.
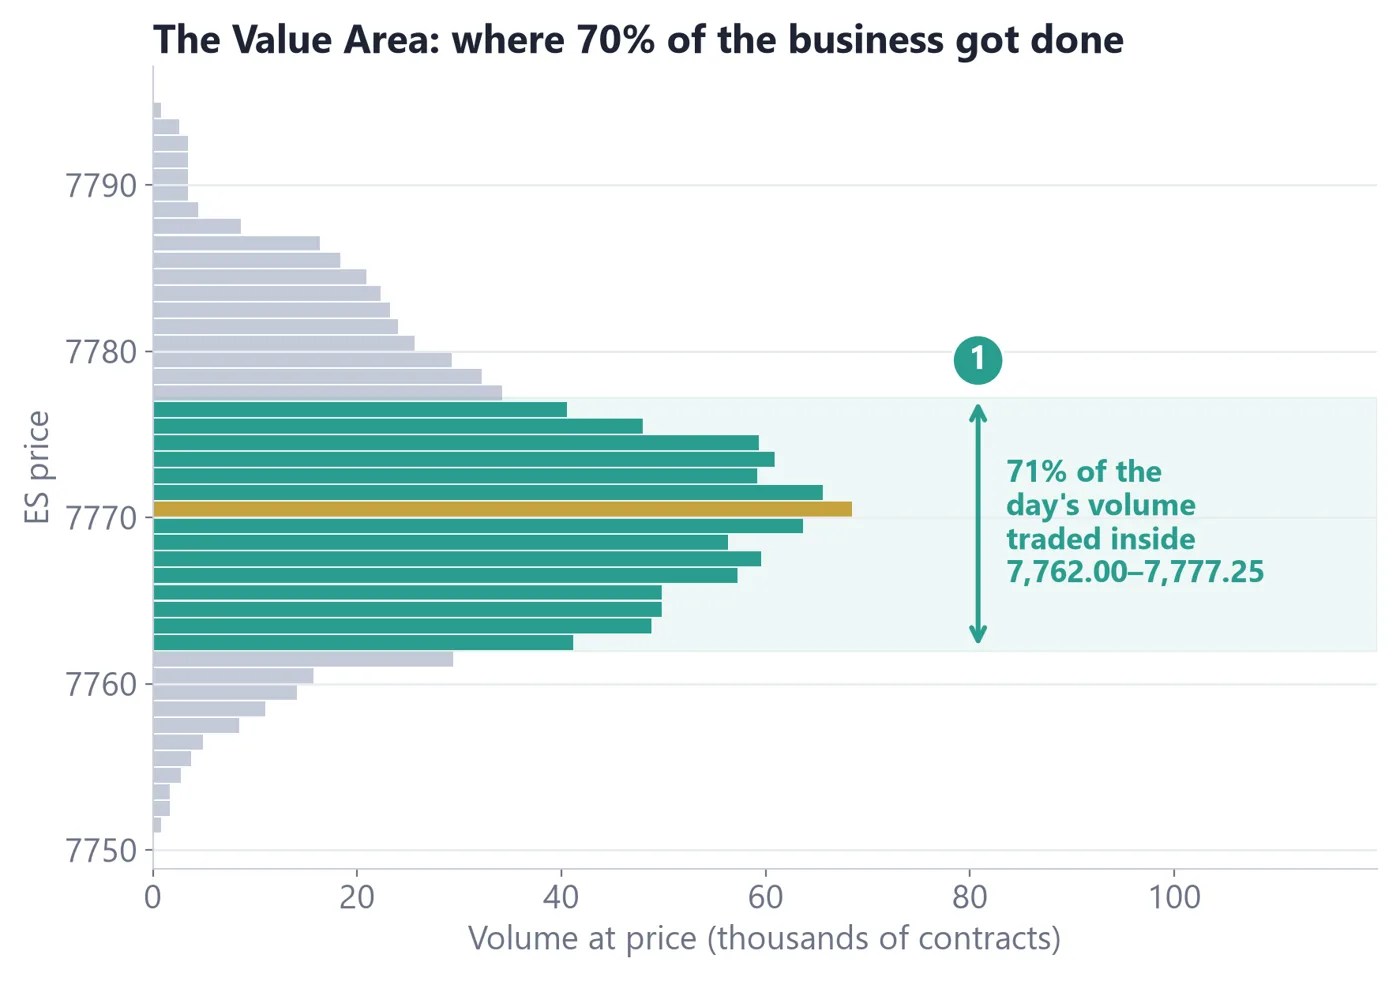
- 1The shaded zone holds about 70% of the volume.
- 2The VAH and VAL are the upper and lower edges.
- 3Price acceptance outside the value area is consistent with a shift; a quick return inside is consistent with rejection.
- 4These are observations, not rules.
How does this help with options? In three small ways. First, breakeven check: if the breakeven of a call sits beyond a nearby key level that has stopped price before, the idea needs more than a simple move. Second, timing: the premium decays daily, so waiting inside a quiet range costs money. Third, risk definition: an idea that fails if price closes back inside the value area can be matched to a spread whose maximum loss you have already sized (Lesson 7).
A reminder on SPY versus ES: SPY moves in roughly the same direction as ES, but you must convert levels yourself, and the cash market hours differ from the nearly 24-hour futures session. All the SPY numbers below are round placeholders, not conversions of real levels.
8.3 Two hypotheticals: one fails, one is skipped
Hypothetical example that fails. On a day shaped like the Oct 30 trend day, a trader sees price stretched below the lower 2-standard-deviation band and thinks 'it must snap back to VWAP'. SPY is 600 hypothetically. The trader buys a one-day 600 call for 1.20, paying 1.20 x 100 = $120. Price stays beyond the bands and keeps falling to 595 by the close. The call expires worthless, and the loss is the full $120, or 100% of the premium. The mistake was not the loss itself; it was treating a stretched price as a reason when the day was a trend day. The trade log should say: 'Did not check whether the day looked like a trend or a reversion day before buying a one-day option.'
Hypothetical example that is skipped. SPY is 600 and sits in the middle of yesterday's value area. A trader likes the idea of a bounce toward the value area high, 4 points away at 604. The 600 call with 7 days left is quoted 1.60 bid and 2.00 ask. The breakeven is 600 + 2.00 = 602.00, so the 604 target is only 2 points past breakeven. At expiry the call would then be worth 4.00 against 2.00 paid, a gain of $200 at best, for $200 at risk. The bid/ask gap alone costs 0.40 x 100 = $40 round trip, which is 20% of that best-case gain. Price is mid-range with no nearby level to react to. The trader writes 'skipped: breakeven too close to the target, spread too wide, no location edge' and takes no trade. A skipped trade with a written reason is a good outcome.
- VWAP, bands, value areas and key levels are context for options, not signals.
- Compare the breakeven with nearby levels and check the expiry gives your idea enough time.
- A trend day can keep price beyond the bands, which is a risk for reversion ideas, especially in short-dated options.
- Log failed and skipped ideas with reasons; both teach.
Quick check
Pass with 2 of 3 to complete the lesson (+20 XP, plus 5 XP per correct answer the first time).
1.Which best describes how chart context relates to options?
2.A trader buys a one-day call because price is below the lower VWAP band, and the day trends down. The main lesson is:
3.Why log a skipped trade with a written reason?