Lesson 6 · 10 min
A three-layer study framework: Where, Why, When
You’ll learn
- The three layers of the framework and the question each answers
- How to score a set-up on a simple scorecard
- Why a clear skip rule matters as much as an entry rule
5.1 Three layers, three questions
When you combine several tools, the screen gets crowded. A framework keeps you organised. This one has three layers. Each layer asks one question, and you need an answer to all three before a set-up is even worth studying.
| Layer | Question | Tools from this series |
|---|---|---|
| Where | Is price at a level that I marked in advance? | Prior-day value area and POC (Guides 1 and 2), VWAP, anchored VWAP, prior highs and lows |
| Why | What is the context that makes this level interesting today? | Day type, open relative to value, VWAP slope, where the liquidity sits |
| When | What specific evidence is showing now that I defined in advance? | Footprint patterns from Guide 3: absorption, exhaustion, stacked imbalances, delta |
The layers go in this order on purpose. Location comes first because a pattern in the middle of nowhere tells you little. Context comes second. The footprint trigger comes last because it is the most detailed, and the easiest to over-read.
The same framework works on any market and any timeframe. The only requirement is that each layer has a definition you wrote down earlier. If you cannot say what would make a layer score 0, 1 or 2, the layer is too vague to be useful and you should tighten it before using it.
5.2 A sample scorecard (illustrative)
A scorecard turns the layers into a quick check. The one below is an illustrative example of the idea. It is not a tested system, and its numbers are not recommendations. Build your own, and test it on a demo account before relying on it.
| Layer | 0 points | 1 point | 2 points |
|---|---|---|---|
| Where | No marked level nearby | Near a level, but only one reason | At a level that several of your tools agree on |
| Why | Context argues against the idea | Context is neutral | Context supports the idea |
| When | No footprint evidence | Weak or partial evidence | Clear evidence you defined in advance |
Three gates sit on top of the scorecard in this example. Gate 1: every layer must score at least 1. Gate 2: the total must be at least 5 out of 6. Gate 3: the distance to the first target must be at least 2 times the distance to the stop. If any gate fails, the answer is to skip.
Gate 3 uses the idea of 'R'. One R is the amount you risk on a trade, measured by the stop distance. If your stop is 10 ticks away and your first target is 30 ticks away, the reward is 3R. On ES, 1 point is $50 and 1 tick (0.25 points) is $12.50, so a 10-tick stop is $125 of risk per contract. Lesson 8 uses this arithmetic.
Three points on the scorecard itself. First, it is deliberately small so you can complete it in under a minute. Second, the 5-out-of-6 threshold is an example. You may choose a different one, but choose it before you start. Third, the scorecard says nothing about outcomes; a high score does not make a trade win. It only measures whether your own conditions were met.
5.3 Seeing Where and Why on a real day
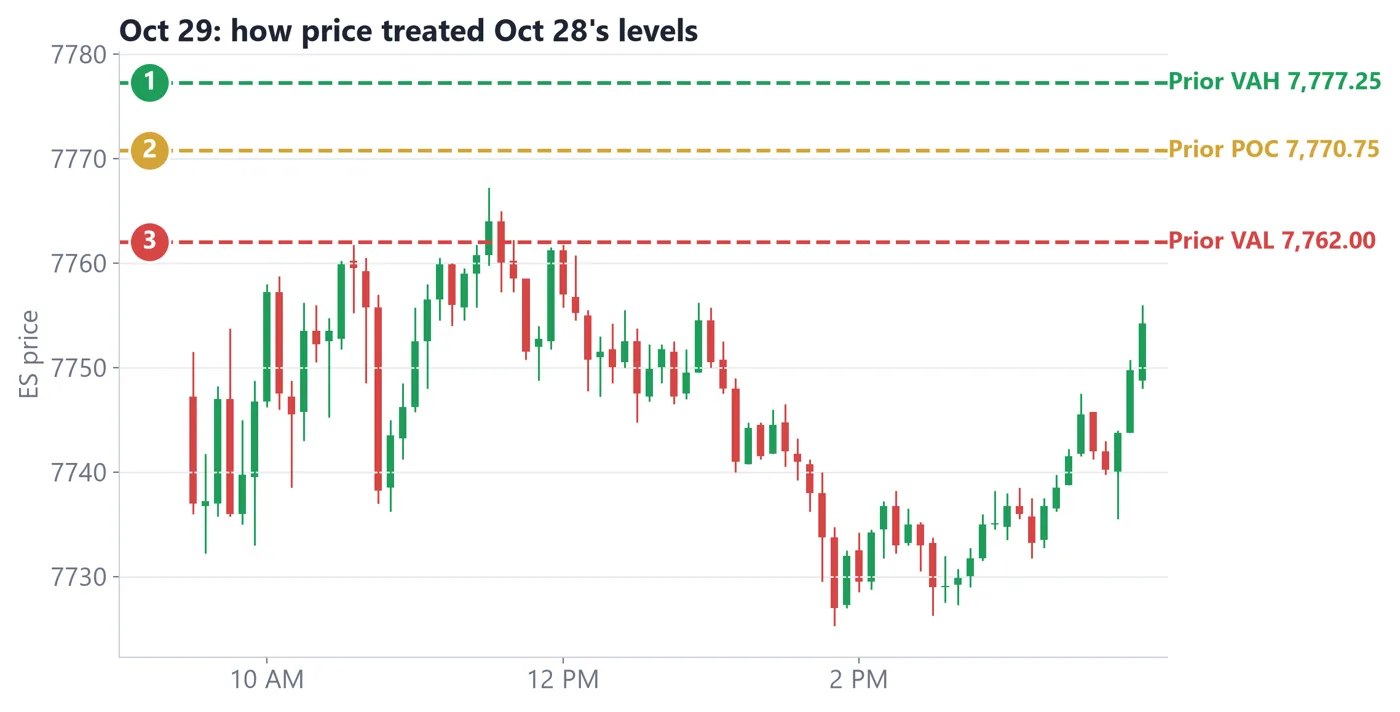
- 1Reference: Oct 28 POC 7,770.75, VAL 7,762.00, VAH 7,777.25.
- 2Oct 29 opened below the prior VAL, poked back above it for about 15 minutes, then fell to 7,725.
- 3This chart can illustrate the Where and Why layers only. We do not have tick data for this day, so there is no When layer here.
The chart shows how the first two layers might be filled in. Where: the prior day's VAL at 7,762.00. Why: price opened below it, so the open was outside the prior day's value. Whether you would have had a valid trade depends on the third layer, and no footprint exists for this day in our data. A framework that cannot be completed is a framework that says skip.
It also shows an important point: a plan is a set of questions, not a prediction. Having the three layers on paper before the open means you react to evidence rather than invent a story afterwards.
- Where, Why, When: location, context, then evidence.
- A scorecard with gates makes skipping a rule rather than a mood.
- 1R is the amount risked; on ES a tick is $12.50 and a point is $50.
- The scorecard here is illustrative, not a tested system.
Quick check
Pass with 2 of 3 to complete the lesson (+20 XP, plus 5 XP per correct answer the first time).
1.Why is the layer order Where, Why, When?
2.On ES, how much is one tick worth?
3.A set-up scores Where 2, Why 0, When 2. What does the example framework say?